EnergyLab
An EV charging hub you can steer in the browser
- ~2.45 MWhSecond-life battery buffer in the hub it models
- 320 kWPer high-power charging point the twin simulates
- Energy <-> ProfitTwo optimisation views of the same 3D scene
- Client
- Volkswagen Group
- Location
- Germany
- Industry
- Energy & mobility
- Services
- 3D Scene, Digital Twin, Data Visualization
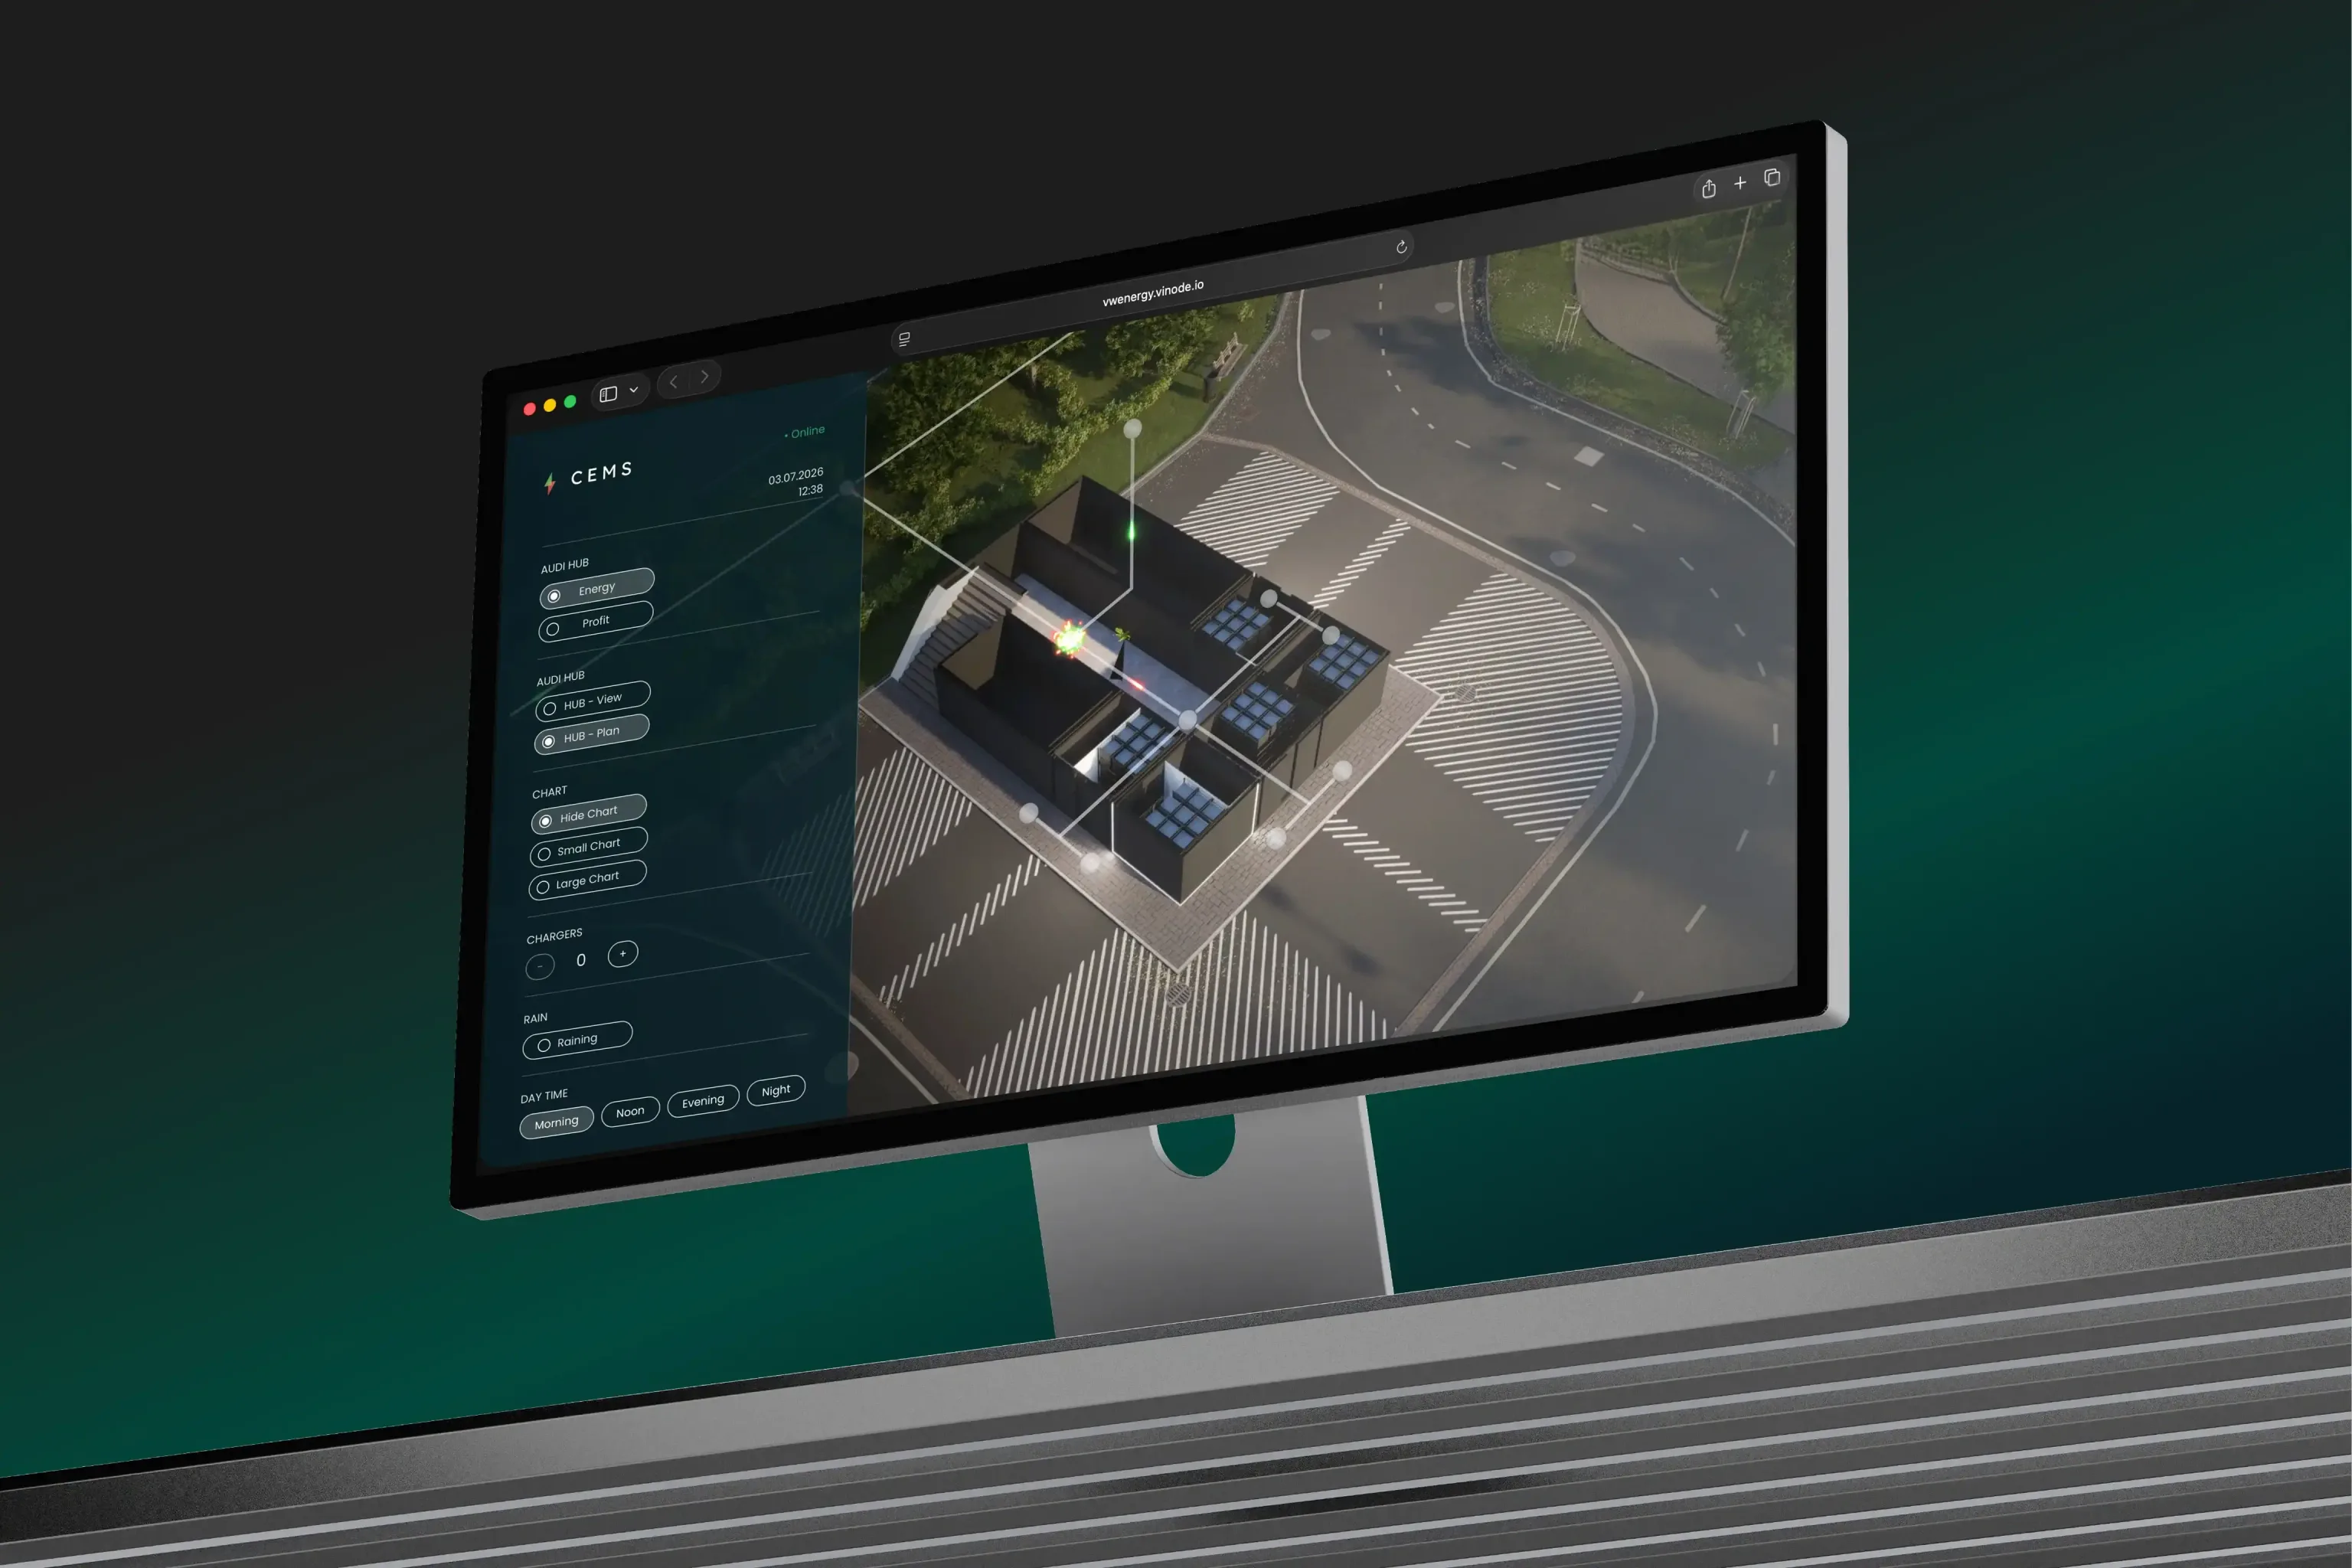
Most people cannot picture how an EV charging hub actually works. Solar panels feed a battery buffer, the buffer smooths a weak grid connection, cars pull hundreds of kilowatts in minutes, and the economics flip depending on the weather and the time of day. Explaining that with a slide deck loses the room. So instead of a deck, we built the hub as a 3D digital twin you drive: change the sun, add chargers, switch from an energy view to a profit view, and watch the whole system respond in the browser.
What we were selling
EnergyLab is an interactive twin of a modern charging hub, grounded in the real Audi charging hub concept and Volkswagen Group's Elli energy platform. The 3D scene is not a picture of the hub; it is the interface to it.
The scene is the dashboard
A control panel (labelled CEMS in the build) sits beside the live 3D hub: toggle between an Energy view and a Profit view, switch the hub between plan and perspective, and size the data chart from hidden to full.
A hub with real physics
Rooftop photovoltaics on the charging cubes, a second-life battery buffer, and high-power charging bays: the same elements as an Audi charging hub, arranged so their relationship is visible at a glance.
Built to be steered
Add or remove chargers with a counter, bring in weather, and move the clock across the day. Each input changes what the twin shows: solar yield, buffer state, charging load and the resulting numbers.
Why the usual tools fall short
An energy hub is a systems-engineering story told to people who are not systems engineers: executives, partners, planners, buyers. The twin had to:
- Make an invisible flow, from sun to panel to battery to car to grid, legible without a single equation on screen.
- Respond to what-if inputs (more chargers, bad weather, night-time demand) fast enough to feel like a live model, not a video.
- Show two different truths from one scene: the energy balance and the money, on demand.
- Run in a browser for a non-technical audience, with no specialist software to install.
How we built it in Vinode
We modelled the hub in Unreal Engine and delivered it through Vinode, so a photorealistic, data-bound scene runs in an ordinary browser. The difference from a marketing render is that here the 3D is wired to state: the controls on the left don't just move the camera, they change what the system is doing.
Change the world, watch the numbers
The time-of-day control moves the hub through morning, noon, evening and night, and the rooftop solar responds the way real photovoltaics do: strong at noon, gone after dark. Switch on rain and generation drops. Add chargers with the counter and the draw on the buffer and grid climbs. Because the model recomputes as you touch it, a viewer builds intuition by playing rather than by reading a table.
Two views of the same hub
The Energy view shows the physical balance: what the panels make, what the battery holds, what the cars take. Flip to the Profit view and the same scene answers a money question instead: when this hub earns and when it costs. That mirrors how these systems are actually optimised, charging on cheap or solar-surplus hours and selling flexibility back when the grid pays for it.
Grounded in a real energy concept
The twin is modelled on the Audi charging hub, a real high-power charging concept that uses reconditioned, second-life lithium-ion batteries as a buffer so a site can offer fast charging on a weak grid. Audi's Nuremberg pilot pairs about 2.45 MWh of second-life storage, six charging points at up to 320 kW, and only a 200 kW grid connection, topped by up to 30 kW of rooftop solar. The economics the Profit view dramatises are Volkswagen Group's own case for smart and bidirectional charging: Elli reports price- and solar-optimised charging cutting costs by up to 40%, and bidirectional use up to 75% under favourable conditions. The twin turns those figures into something a non-engineer can feel.
Results
Making an energy system playable changes who can understand it and how fast:
A board can see the physics
In our experience stakeholders grasp a hub faster by watching the sun charge the buffer and the cars drain it than by reading its single-line diagram. Solar, storage, charging and grid stop being bullet points and the architecture explains itself.
What-if without a spreadsheet
Add chargers, bring the weather down, push demand to night, and the energy and profit views update live. Planning conversations happen against a model instead of against assumptions.
A demonstrator, not a control room
This is a communication and scenario twin, not a SCADA system wired to live hardware. Its job is buy-in and understanding for a non-technical audience, so we optimised for clarity over telemetry.
EnergyLab shows Vinode's 3D working as an operational twin rather than a brochure render. The same browser-native engine that sells apartments here binds to the state of an energy hub, so solar, battery and charging load become something a non-technical audience can steer and understand. Be clear on what it is not for: an operations team that needs a certified real-time control system on live hardware should look elsewhere. What this earns is a shared, accurate mental model of how a hub behaves before a euro is spent building one, and that is how to judge it: does the room leave understanding the system.
Want a project like this?
See what an interactive Vinode experience could do for your development.