
The real cost of streaming 3D per viewer: a worked GPU-and-CDN cost study
Key Takeaways
- Pixel-streaming cost scales with peak concurrent viewers: each holds roughly one cloud GPU, plus a warm buffer you pay for whether viewers arrive or not.
- Pre-rendered serving is billed as tiered CDN egress, so the per-gigabyte rate steps down as volume rises and later viewers cost less than the first.
- The two cost curves cross, and where depends on two measurable inputs: viewer session length and asset payload size.
- Packing more streams onto one GPU cuts streaming cost but forces a lighter scene, so the money-saving lever degrades the render.
A vendor tells you their interactive 3D tour "scales fine." Fine at what price, and in which direction? That is the question a finance reviewer is stuck holding, because a per-user figure quoted in a pitch deck hides the one thing that decides the bill: whether cost per viewer climbs or falls as the crowd grows. The two common delivery models answer that in opposite directions, and no amount of image quality tells you which you are buying.
This piece does the arithmetic. It computes what 100, 1,000 and 10,000 concurrent viewers cost under each model at dated, public cloud rates, so you can drop your own launch-day numbers into the same two formulas. The companion piece, pixel streaming vs pre-rendered 3D, argues the qualitative choice. This one is the worked-numbers version of that argument, and nothing here touches the one-time production build, which is quote-only and stays unpriced.
The invoice you can't see on launch day
Strip the marketing away and a finance buyer faces a two-column question. Where does the serving money actually sit, and which way does it move as traffic climbs from a quiet Tuesday to the busiest hour of the campaign? Get the direction wrong and you provision for the average and get billed for the peak.
Column one is real-time pixel streaming: an Unreal scene runs live on a cloud GPU and the rendered frames are streamed to each browser, so you rent compute for the whole time every viewer watches. Column two is pre-rendered: the scene is baked once, ahead of time, then served as bytes from a content delivery network the way any site ships a video. One meters compute-hours, the other meters gigabytes shipped, and those two meters do not scale the same way. That is the whole study.
Why one GPU per viewer is the honest model
The streaming column only has a defensible unit cost if you can say how many GPUs a given crowd needs. You can, and the number comes from the vendor of the engine's cloud reference, not from a guess. Microsoft's reference architecture for running Unreal pixel streaming at scale defaults to one Unreal instance per GPU, and to stop new arrivals from queueing it keeps a buffer of idle streams warm and ready (Microsoft - Unreal Pixel Streaming at Scale in Azure).
So the model is: GPUs in service is roughly concurrent viewers, plus a warm buffer on top. That buffer is not a rounding error. It is idle capacity you pay for so the hundred-and-first viewer does not stare at a spinner, and Microsoft is blunt that skipping it makes users "stack up waiting for an available stream." The warm buffer is the cost of not queueing your launch-day crowd, and it lands whether or not the crowd arrives.
All streaming figures below use an NVIDIA L4 GPU via a g2-standard-4 machine at roughly $0.70 per GPU-hour, on-demand, region us-east4, read on 2026-07-04. GPU rates move by model, region and commitment, so re-verify against the live page before you commit any of this to a spreadsheet: Google Cloud GPU pricing. Every number here is illustrative, meant to show the shape of the curve, not to quote your bill.
Streaming, worked: 100 / 1,000 / 10,000 viewers
Take one busy launch hour and assume the concurrency figure is the number of people watching at the same moment. The streaming formula is short:
peak concurrent viewersxGPU-hour ratexsession hours + warm-buffer overhead.
Hold the session at a realistic hour of browsing and the buffer at a modest ten percent of the fleet, kept warm. At $0.70 per GPU-hour, one viewer-hour is about $0.70 of GPU, before the virtual machine, the video encoding and the egress that ride along with it. Now scale the crowd.
One launch hour of pixel streaming (illustrative, L4 at ~$0.70/GPU-hr)
100 concurrent
110 GPU-hours once you count the warm buffer. About $77 an hour, or roughly $0.77 a head - and that head-rate does not fall as you add people.
1,000 concurrent
1,100 GPU-hours, about $770 an hour. Still roughly $0.77 a head; the curve is flat-to-rising, never declining.
10,000 concurrent
11,000 GPU-hours, about $7,700 an hour - assuming the region even has 10,000 L4s free to hand you at once. The head-rate holds at $0.77.
The number that matters is the one that does not change: cost per viewer sits near flat and can tick up, because every extra concurrent viewer pins another GPU-hour at a fixed rate and the warm buffer scales with the fleet. There is no volume discount hiding in a busier launch. Worse, the total peaks on exactly the hour you least want a large bill, the hour your campaign is working hardest. A buyer who leaves the tab open all afternoon multiplies their own line by the hours, not the clicks.
I think this is the single most mis-sold property of streaming: the demo is quiet, so the per-viewer cost looks trivial, and the model that a successful launch produces never gets tested until the invoice lands. The mistake finance teams make is trusting the demo-day number instead of the launch-day one.
Pre-rendered, worked: the same crowd on a CDN
The pre-rendered column meters something else entirely: bytes shipped. The formula is:
viewersxpayload GBxtiered egress rate.
Payload is what one viewer downloads to run the full tour, and egress is priced per gigabyte in tiers that step down with monthly volume. On Google Cloud's standard-tier network egress the steps run roughly $0.12/GB for the first terabyte a month, about $0.11/GB across the next nine, and about $0.08/GB beyond ten terabytes (Google Cloud network pricing). Because the rate falls as you cross tiers, the ten-thousandth viewer's bytes are literally cheaper than the first's. Put a 150 MB tour payload through the same three crowds.
Serving the tour from a CDN (illustrative, 150 MB payload, tiered egress)
100 viewers
About 15 GB shipped, all inside the first tier at ~$0.12/GB. Roughly $1.80 total. Per viewer: about 1.8 cents.
1,000 viewers
About 150 GB, still first-tier. Roughly $18 total. Per viewer: still about 1.8 cents - and about to start falling.
10,000 viewers
About 1,500 GB, now crossing into the cheaper tier. Roughly $174 total. Per viewer: about 1.7 cents and dropping as volume climbs.
Cloud egress pricing changed in May 2026, and the tier steps above are read on 2026-07-04. Treat the exact per-gigabyte figures as directional and confirm them against the live network pricing page before you build a budget on them. The mechanism, tiered rates that step down with volume, is what produces the declining per-viewer cost; the precise cents are yours to re-check.
Read the two tables side by side and the divergence is stark. At 10,000 viewers the streaming column is around $7,700 for a single busy hour, and the CDN column is around $174 for the whole crowd, with the per-viewer cost still falling. That is not a fixed multiplier you can ballpark once. It is two curves whose slopes point in opposite directions, one held up by GPU-hours at a flat rate, the other pulled down by tiered bytes.
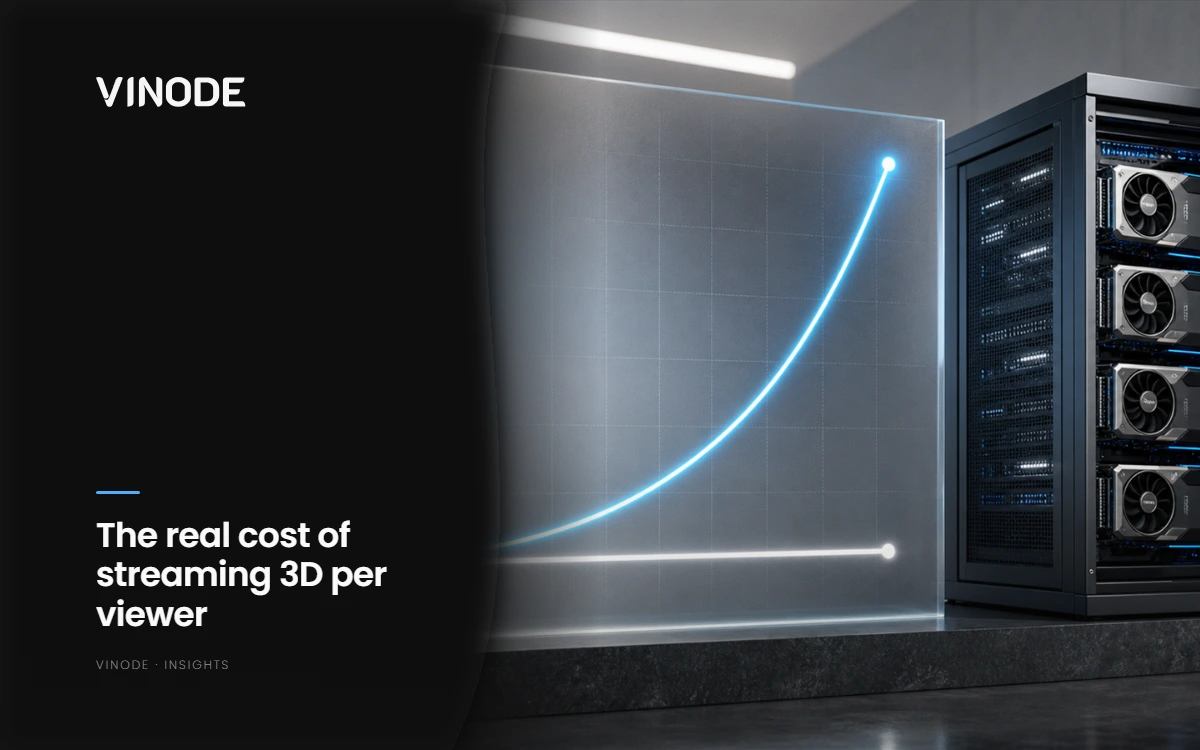
Pre-rendered CDN bytes versus a live GPU-hour per concurrent viewer. The gap is a property of how each meter runs, not of how the render looks.
Where the lines cross
Both models share the same up-front production cost, so on day one they start level. From there the streaming line rises with every concurrent viewer-hour and the CDN line rises far more slowly and then flattens per viewer, which means they cross. The crossover is not set by taste or resolution. It is set by two numbers you can measure before you sign anything:
- Session length. Streaming bills per hour watched, so a longer average session multiplies the streaming column directly while barely touching the CDN column, which charges for the bytes once regardless of how long the viewer lingers.
- Payload size. A heavier asset bundle raises the per-viewer gigabytes on the CDN side, pushing the crossover later; a leaner payload pushes it earlier.
Feed those two into the formulas and you can compute where your own launch lands relative to the crossover, rather than accepting a vendor's per-user figure. Read the answer as lifetime cost, not a monthly line: the streaming meter runs for as long as the tour is live, every busy hour of every campaign, while the pre-rendered serving cost stays a rounding error against the one-time build. This study drills only into that serving column; the full ledger, including how often you edit the experience after launch, lives in the true cost of ownership.
This study is not for a low-traffic tour that a handful of people open for long sessions. There the arithmetic barely moves and either model costs almost nothing, so obsessing over the serving bill on a boutique block that will never see a launch-day crowd is a waste of a spreadsheet. The common advice to "model the infra cost carefully" is overrated below real concurrency; the direction only becomes a budget decision when peak simultaneous viewers run into the thousands, which is exactly the residential launch this is written for. Below that, pick on the qualitative merits and stop counting gigabytes.
The packing caveat and what to ask your vendor
There is one honest lever that bends the streaming column, and it comes with a cost of its own. You can pack several lightweight streams onto a single GPU, which divides the per-viewer GPU-hour and lowers the streaming figures above. But Microsoft's own architecture notes that how many streams a GPU holds depends on how heavy the 3D app is, so packing more streams forces a lighter scene. My view, after shipping both models: for a residential launch this trade is a bad one to take, because the render is the product you are asking a buyer to trust, and shaving scene complexity to fit more streams per card degrades the exact thing the tour exists to sell. If a streaming vendor quotes you an aggressive per-viewer price, ask what stream density it assumes and what that does to the scene.
For a residential sales page the concurrency can be real. At Safa Al Fursan in Riyadh, a 528-unit scheme across 25 buildings and 67,000 m² runs as an offline kiosk in the sales office, a full-inventory demo on one screen with no per-viewer GPU behind it at all. In our experience that is the pattern that wins on a large scheme: the bytes are served once, and the busiest day costs about what a quiet one does. I would go further and argue that for the standard residential launch the pre-rendered column is simply the correct default, and streaming is the option a vendor should have to justify against your specific concurrency, not the reverse.
Do not accept a per-user cost figure. Ask the vendor to model both columns against your actual launch-day concurrency projection - peak simultaneous viewers, realistic session length, and asset payload size - and to show you which way the per-viewer line moves as that crowd grows. If it rises or stays flat, you are on the GPU meter. If it falls, you are on the CDN meter. That single question separates "it scales fine" from an actual bill.
Cost per viewer either falls as your launch succeeds or it doesn't. Make the vendor show you the slope, not a single number.
None of this decides the qualitative choice on its own; genuinely unbounded interaction, a live collaborative design review or free-form wall-dragging, is where real-time earns its meter, and that case is made in the companion comparison. What this study fixes is the finance question underneath it. Serving cost is not a single per-user number to ballpark; it is two curves that cross, and where you land is arithmetic you can now run yourself, on your own concurrency, session length and payload, at a rate you can re-verify on a public page today.
See a pre-rendered tour serve a crowd for the price of bytes
Open a live Vinode project on your worst phone and flakiest connection, then run the two formulas against your own launch-day concurrency.

Masterplan 3D for Phased Estates: How to Show Phase One Without Overselling Later Phases
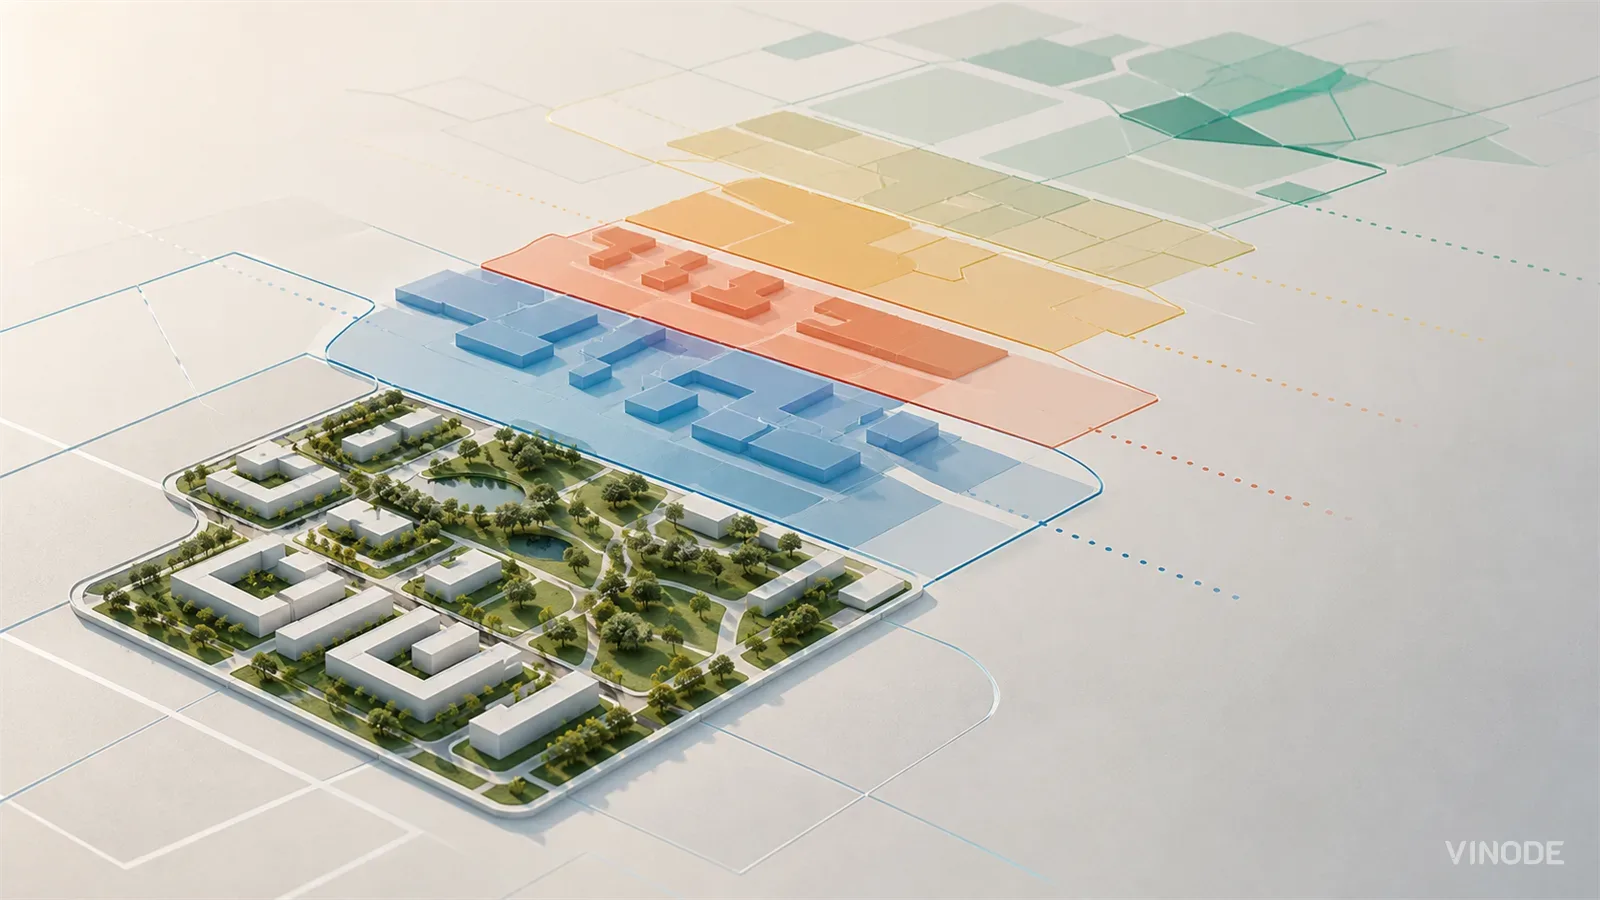
A phased estate contains several levels of certainty at once. The masterplan should make that difference visible, then absorb a later-zone redesign without discrediting the phase-one material buyers already saw.

Why rendered glass façades read as fake: the optics of IGU deflection
Archviz glass reads as fake for a reason no roughness slider reaches. Real curtain-wall panes are slightly bowed, each one differently, so adjacent panes reflect the sky at slightly different angles. A render's panes stay flat because the CAD geometry is flat, and that flatness is what the eye catches.

Off-Plan Rendering: What Reaches the Buyer
A new marketing manager inherits 140 JPEGs, one MP4 and no model. Everything the 3D model knew about the units stayed on an artist's workstation, and three vendors are about to rebuild it by hand. What reaches the buyer depends on what leaves the studio.