
We measured when a pipeline crosses the presale line, not just whether it will

Key Takeaways
- New-development sales are front-loaded, so a straight-line pace projection undershoots early and overshoots late.
- Lenders count exchanged contracts. A pipeline at 60% reserved can sit at 35% by the lender's count because cancellations widen the gap.
- Stage-conversion rates predict the crossing date. The sold percentage does not. It tells you position, not trajectory.
- Published benchmarks measure different stages in different markets. Borrow a conversion rate and you get someone else's crossing date.
For about five years, the sold percentage was enough. GTHA opening-quarter absorption averaged 66% over the decade to 2021 (Urbanation). A developer with 200 units could divide units sold by weeks elapsed, draw a line, and the presale crossing date landed close enough. Market moved fast. Straight-line worked.
Then it stopped. Q1 2026 saw 246 new condo sales across the entire Greater Toronto and Hamilton Area, down 94% from the ten-year average, and no new project launches for teh first time in over 30 years (Urbanation). Opening-quarter absorption had already fallen to 17% by Q2 2024 (Urbanation). The straight line still produces a date. That date stopped being real.
Fewer than one average project launch. New projects in 2021 averaged 270 units (Urbanation).
Source: Urbanation - as of
Why the sold percentage stayed on the dashboard
Every CRM defaults to percentage sold. The Monday sales meeting runs on it because everyone in the room understands the number without explanation. When the market absorbed fast, that number moved fast, and nobody questioned it. The percentage became the answer to 'are we on track' because for a while it was.
Your lender asks when you cross. Trajectory. The sold percentage answers where you are. Position. Two different questions, and the conditions that made them close enough have been gone since about 2023.
Three inputs the sold percentage hides
Stage-conversion rates. How fast a viewing becomes a reservation, and a reservation becomes an exchanged contract. These rates move independently. One developer client's CRM showed lead-to-viewing jump from 9% to 18.8% in a single quarter (+109%), but offer-to-close fell 11% over the same period. One project, one quarter, client-reported. The two rates produce completely diffrent crossing-date projections. Do not borrow someone else's rate. Published benchmarks measure different stages in different markets, and the spread makes a borrowed number useless for your project.
A cancellation haircut. Gross reservations are what your sales team reports. Your lender counts net exchanged contracts. Taylor Wimpey reported a 14% cancellation rate, rising to 16% in 2025 (Investegate, 28 Apr 2026). US buyer-level cancellations hit 15.1% in August 2025 and passed 16% by December (Redfin, Oct 2025). GTHA project cancellations doubled in 2025 to 7,243 units across 28 projects (Urbanation). These are different phenomena - buyer fallout, whole-project scrapping, market-cycle distress. Measure your own.
Remaining-inventory ceiling. Most pipeline velocity formulas assume the funnel refills. A 200-unit development that sold 120 has 80 left. Apply the formula to units still available. That number only goes down.
Three inputs the forecast needs
Stage-conversion rates
How fast deals move from viewing to reserved to exchanged. Each stage has its own rate and they change independently.
Cancellation haircut
The gap between gross reservations and net exchanged contracts. Your lender counts the net number.
Inventory ceiling
Remaining units cap the forecast. A 200-unit project at 120 sold has 80 possible deals.
The sell-through curve is front-loaded
Across projects with 20 or more units in our portfolio: 30% of units reserved in launch month. 60% by end of first quarter. 90% by month seven. Full sell-out averaged 12.7 months. First-quarter pace was more than five times the pace of the subsequent tail.
The median unit was reserved in the third sales month. A straight-line projection at the same point sits at about 24%.
Source: Vinode measurement - as of
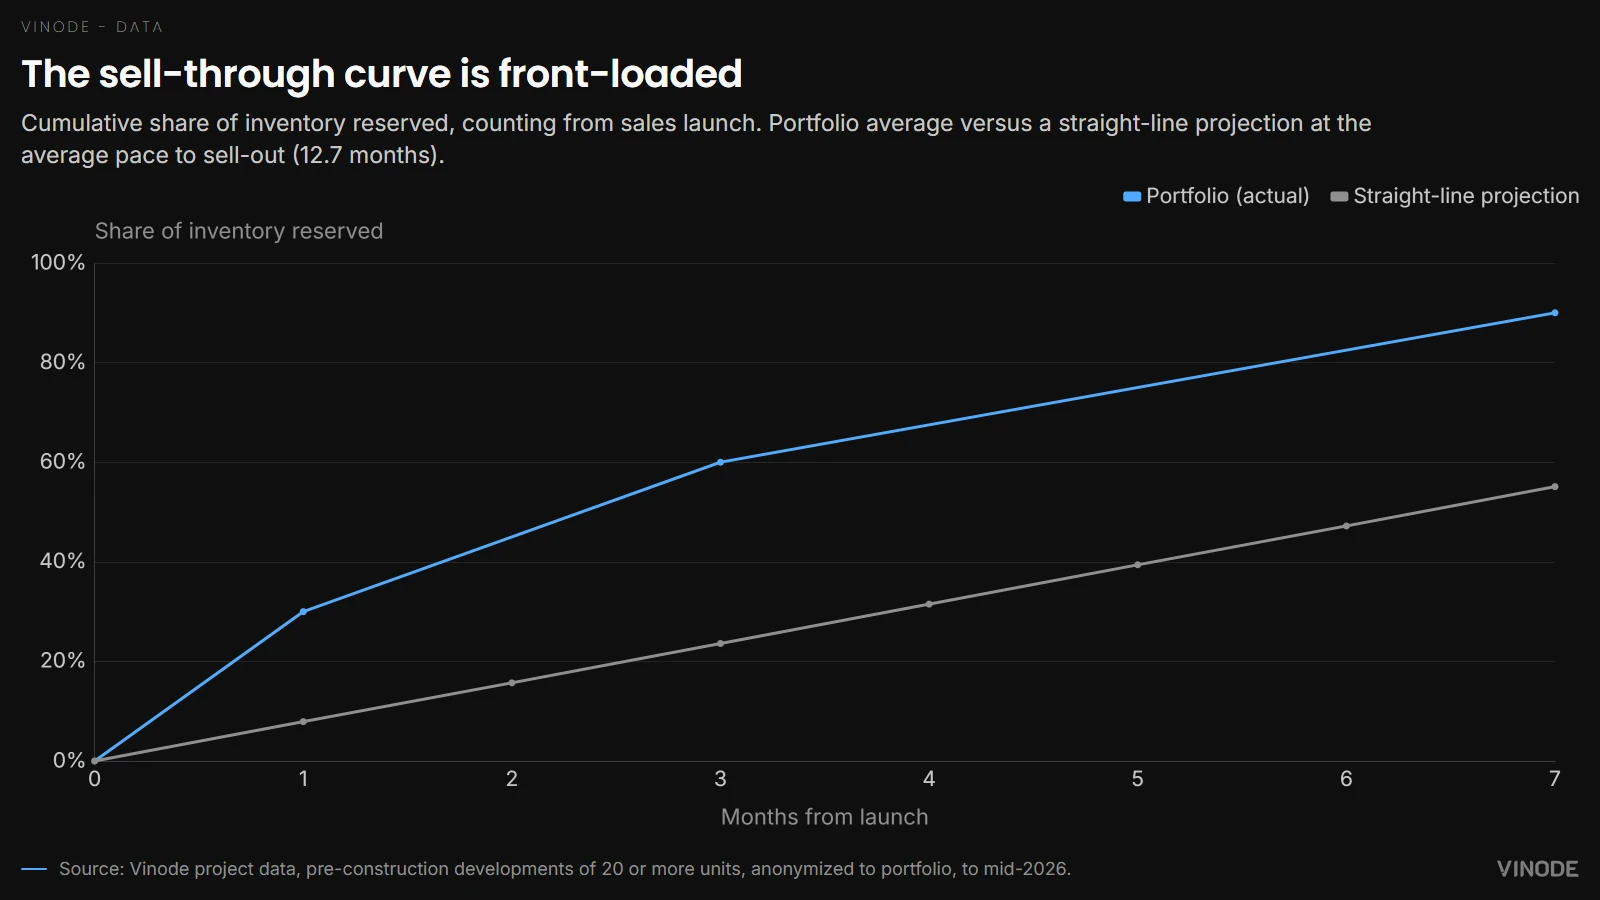
Because the pace drops after the first quarter, a straight-line projection from launch data gives you a crossing date that is too early. From the tail, it gives one that is too late. Front-loaded is the shape, and the shape is itself a forecasting input.
The gap between reserved and exchanged
One project in our portfolio, mid-sales-cycle, measured from pipeline data: 60% reserved, 35% exchanged. That is the distance between the report sales team reads every Monday and the report that decides whether the construction loan releases.
In a falling market, cancellations rise, exchange timelines stretch, and the two counts pull apart exactly when you need them to converge.

When the crossing-date question does not exist
Projects with no presale covenant. If the construction loan does not gate on a sold percentage, this forecast has no object. Projects with fewer than about ten active pipeline deals at any stage. Conversion rates bounce too much to project from, and one deal falling through moves the crossing date by weeks.
What the sold percentage still tells you
One number: where you stand at this moment. The pipeline forecast adds when you arrive and by what route. You need both. The percentage is what your lender checks against the covenant in ten seconds. The forecast is what you bring when they ask whether that position is moving.
The output of that forecast is a date range, because one large multi-unit deal swings the projection by weeks and seasonality in pre-construction sales has no published curve to correct against.
See how the pipeline tracks in practice
Vinode's Back Panel tracks pipeline stages, conversion rates, and sell-through projections alongside the 3D experience.


Digital Sales Gallery: What to Test Before the Display Suite Opens
The afternoon before opening, the sales lead sends herself a test enquiry and the sales desk cannot find it. Four things go wrong most often in a digital sales gallery, and each has a test you can run on the real devices and a fallback if it fails.

How to Move a Live Property Launch Off a Spreadsheet
Three weeks from launch, new enquiries were going into a spreadsheet tab called new leads 2. Move new leads and current unit data first, let old deals finish where they started, and leave the historical import until later.

AI Property Imagery in 2026: A Trust and Governance Playbook for Developers
A label tells buyers that AI touched an image. It cannot tell your team which design revision supports the image, who approved its claims, where it is live, or how to withdraw it.