
Mortgage Demand Is Back Near 1990s Territory. The Next Housing Battle Is Conversion
Key Takeaways
- The MBA Purchase Index measures mortgage applications and leaves out cash buyers and completed sales.
- Mortgage rates near 7% have made affordability the hard limit that marketing cannot remove.
- Builders are already paying for weak demand through price cuts and incentives.
- Before giving away more margin, audit where qualified buyers lose context, confidence, or a clear next step.
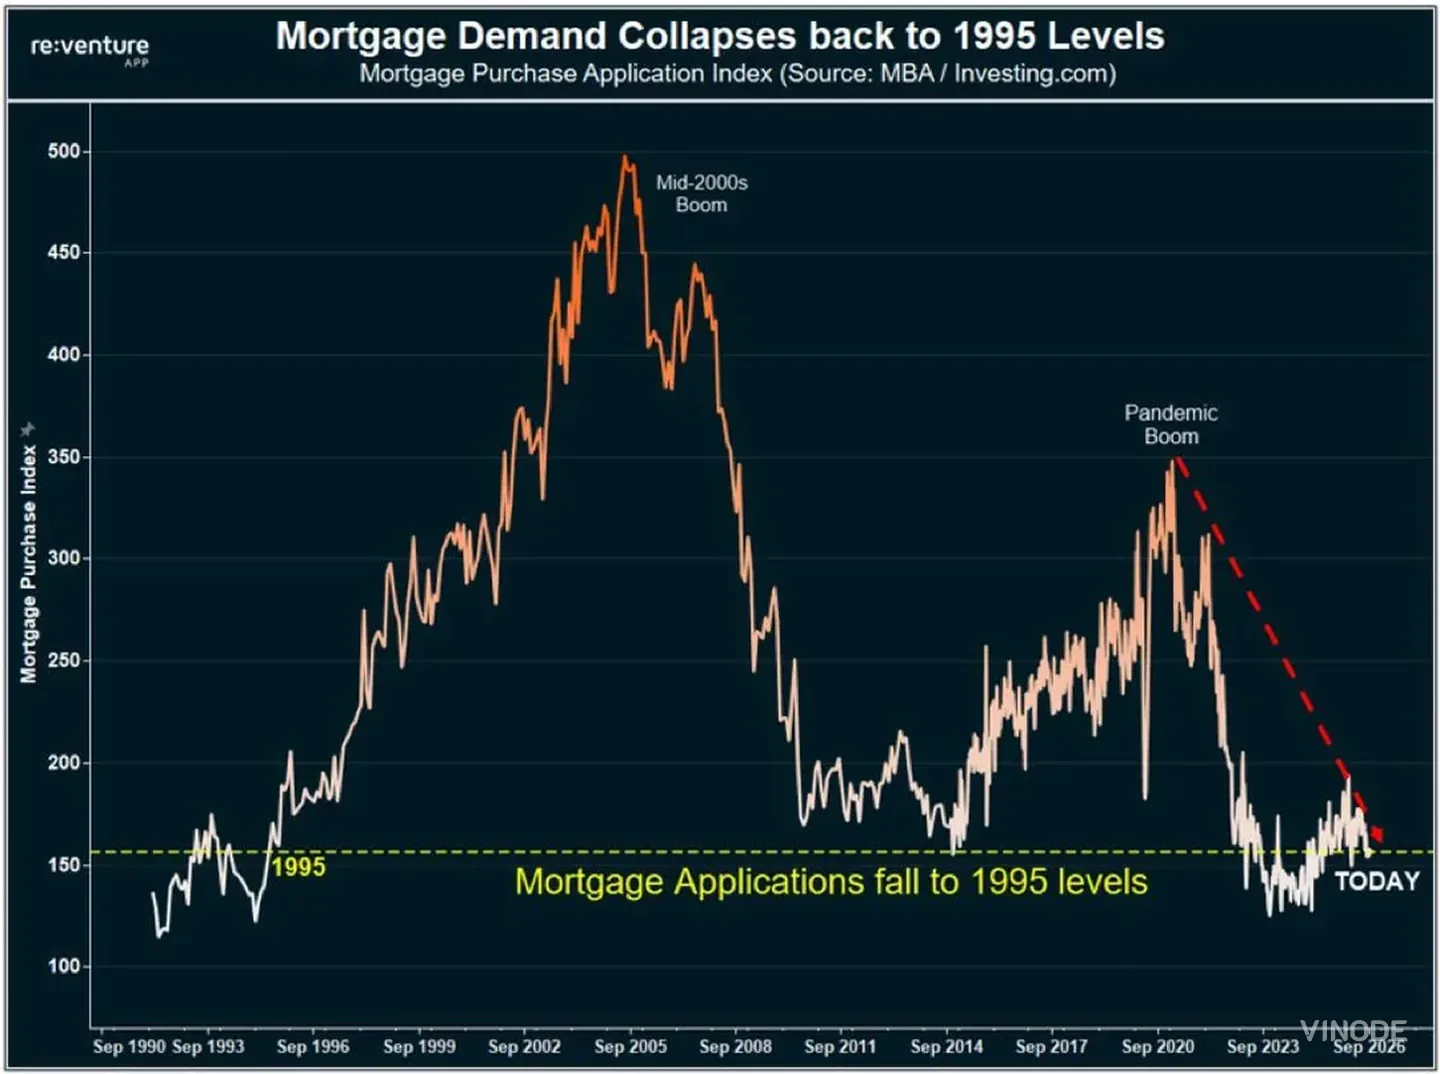
156.2 was the latest published value of the U.S. Mortgage Bankers Association Purchase Index on September 16, 2026. The chart above places it close to readings last seen in the mid-1990s. MBA also reported a 19% year-over-year fall in the unadjusted Purchase Index. (MBA, September 16, 2026; current index value)
A quick translation of the chart helps. MBA is the Mortgage Bankers Association, the U.S. trade body that has run this weekly survey since 1990. Mortgage bankers, banks, thrifts, and credit unions report residential loan applications. MBA turned the first week of the series, March 16, 1990, into a baseline score of 100. A reading of 156.2 means purchase application activity is about 56% above that starting-week level. It does not mean 156 applications, 156 buyers, or 156 homes. The score is useful because it lets us compare activity across more than three decades. (MBA survey guide)
Read the shape from left to right. Applications climbed through the late 1990s, surged during the mid-2000s housing boom, dropped after 2007, then recovered unevenly into the pandemic. The pandemic peak was followed by another steep fall. By September 2026, the line had returned to roughly the range shown around 1995.
That still is not a count of every U.S. buyer. Cash deals sit outside the mortgage application series; they made up 27% of existing-home transactions in August. The careful conclusion is that financed purchase activity has fallen toward mid-1990s index territory. At this level, a developer has less room to shrug off a qualified buyer who leaves.
Purchase mortgage applications, indexed against a 1990 base. It is a strong signal for financed demand, not a census of every buyer. Cash purchases, completed sales, prices, and distressed inventory need separate measures.
6.95% changes the buyer's decision
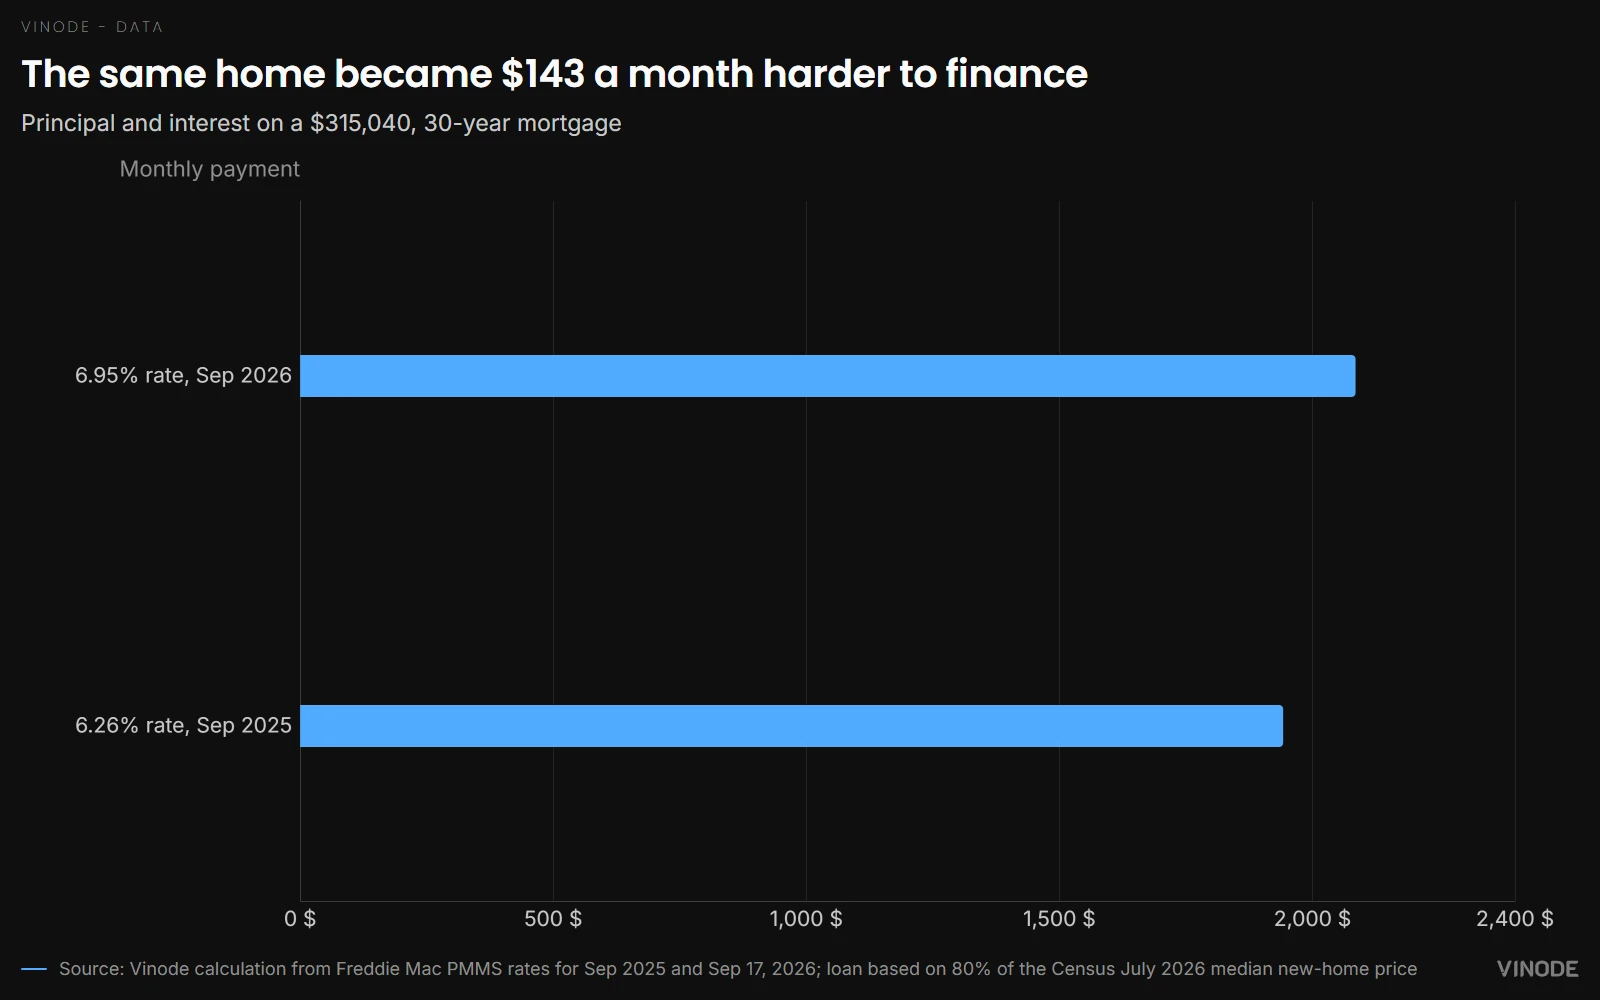
Freddie Mac measured the average U.S. 30-year fixed mortgage at 6.95% on September 17, up from 6.76% one week earlier and 6.26% in September 2025. MBA measured a similar conforming rate at 6.97%. (Freddie Mac PMMS archive)
Use the latest Census median new-home price of $393,800. With 20% down, the loan is $315,040. Principal and interest at 6.95% come to about $2,085 a month, before the rest of the ownership costs. At the previous year's rate, the same loan was about $143 cheaper each month. A buyer can like the home just as much and still walk away.
No rendering repairs a failed debt-to-income test. Faster follow-up cannot create another $143 in a household budget. The sales system has a narrower job: help a qualified buyer find a suitable home, understand it, and carry that context into a useful conversation.
That covers many ordinary reasons people leave: unclear availability, layouts that are hard to compare, views with no orientation, and an enquiry form that forgets everything the buyer just explored.
Inventory gives buyers room
Existing-home inventory reached 1.62 million homes in August, or 4.9 months at the current sales pace. That was the highest supply reading in more than ten years. Sales were down 1.2% year over year, while the median price was up 1.6% and distressed transactions remained at 2%. (National Association of Realtors, August 2026)
This is a slow market with little distress and more buyer choice. People have time to compare. They can negotiate. A confusing sales journey gives them a reason to continue the search elsewhere.
Census estimated 607,000 annualized new single-family sales in July. It also counted 488,000 homes for sale, equal to 9.6 months of supply. (U.S. Census Bureau and HUD) Conditions vary by city and product. Nationally, builders are carrying substantial inventory into a weak financed market.
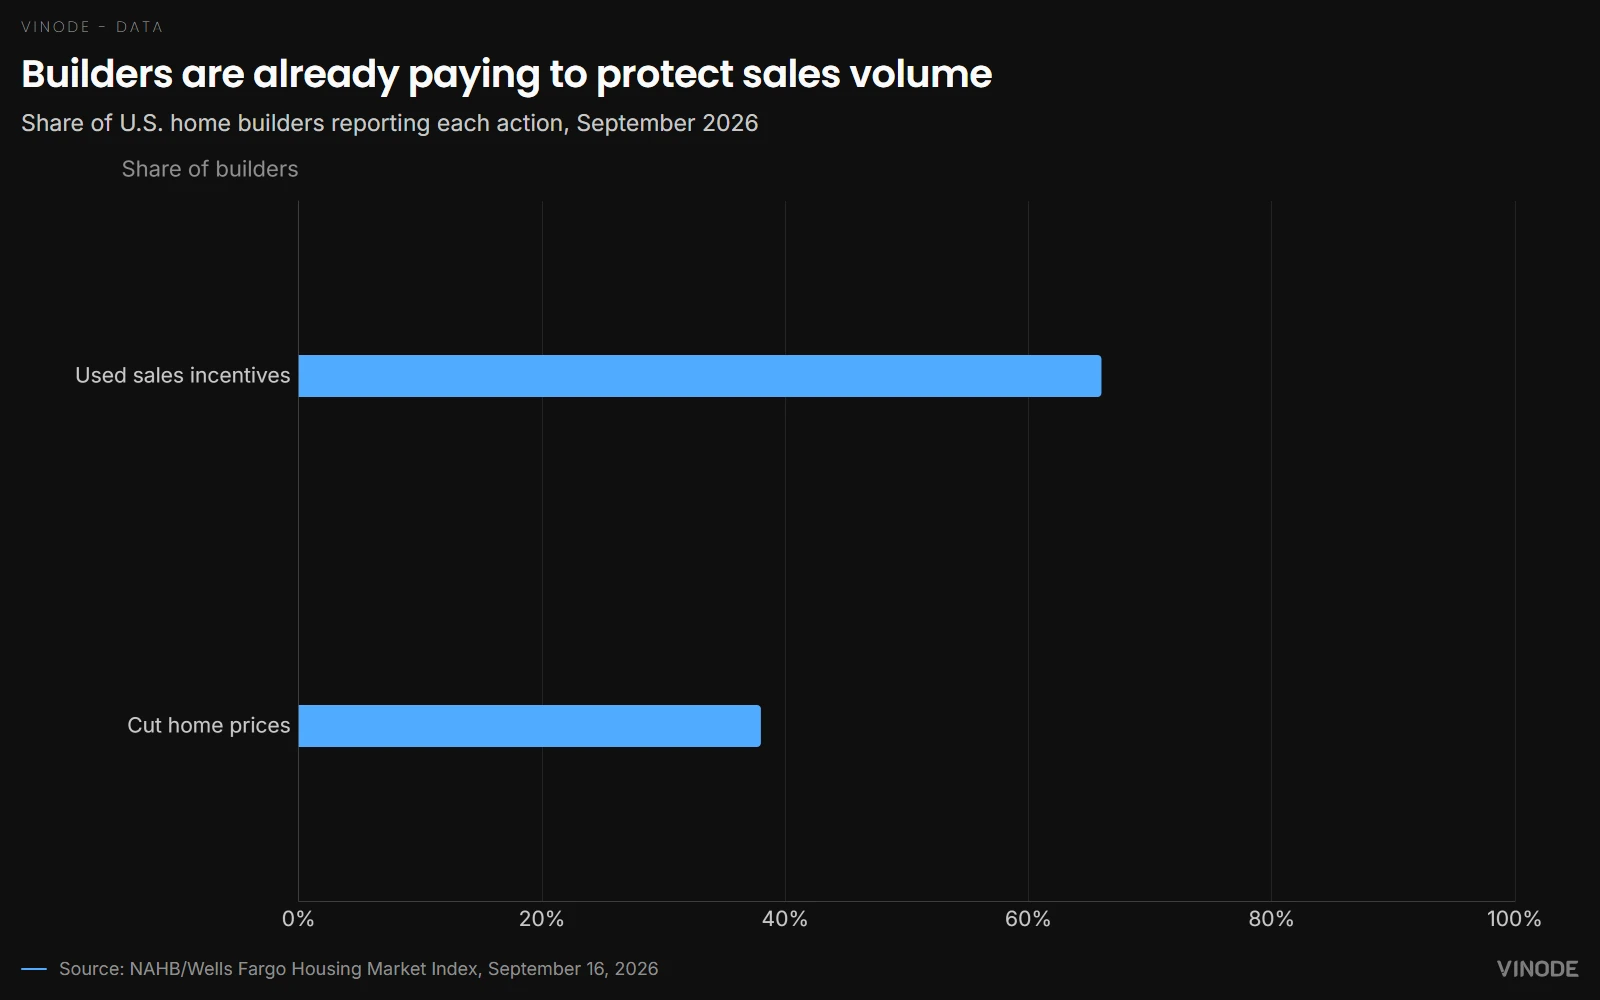
38% cut price. 66% used incentives.
In September, 38% of builders surveyed by NAHB said they had cut prices. The average reduction was 6%. Another 66% used a sales incentive. Builder confidence fell to 32, and prospective-buyer traffic held at 23. (NAHB, September 16, 2026)
Price is fast. A rate buy-down reaches the monthly payment directly, and sometimes that is exactly what a sale needs. The cost appears in the margin. The harder part is knowing whether affordability caused the loss in the first place. A discount cannot diagnose the buyer's exit.
Affordability remains the defining constraint.
Lennar makes the cost visible. Its fiscal third-quarter average selling price was $372,000 and reflected about 12% in incentives, alongside base-price changes used to sustain volume. Home-sale gross margin fell from 17.5% to 15.8%. (Lennar fiscal Q3 results)
One company's figures should stay one company's figures. They still show the trade clearly: margin can bridge an affordability gap. We think that money should solve a payment problem. Spending it to cover missing unit information or a poor handoff is waste.
Check the journey before adding another concession
A national conversion benchmark will not settle this decision. A 2% website conversion rate says little about reservation quality. Ten minutes in a tour might show serious comparison or an abandoned browser tab. In our experience, a property platform that drops the buyer's unit context at the form behaves like a brochure, even when the 3D is excellent.
This advice is not for a project with no qualified traffic, the wrong product for its market, or buyers who cannot finance the purchase. A smoother website cannot create creditworthiness or local demand. Address those problems through the offer, price, finance, and distribution.
For everyone else, use the project's own path. Count the qualified visitors who return, narrow the inventory, compare units, save a shortlist, enquire with a unit attached, book a visit, reserve, and complete. Find the step where people disappear. Our guide to unit-selection UX covers the visible path. The cost-per-lead versus cost-per-reserved-unit analysis follows the money.
Interactive 3D earns a larger role in a slow market when it connects the exploration to live stock and preserves the buyer's choices for sales. Without those links, it remains a visual asset. With them, the salesperson can continue the decision already under way.
Start where the evidence points. Qualification problems call for changes to the offer or finance. Buyers who cannot identify a suitable unit need better discovery and comparison. Context-free enquiries need a joined-up handoff. Stalled reservations need a look at what happens after the form.
The market sets the number of mortgage-ready buyers. How often they have to start again is up to the developer.
Audit the journey before adding another incentive
See how Vinode connects project exploration, unit selection, live inventory, and lead context in one browser-based sales experience.


AI Property Imagery in 2026: A Trust and Governance Playbook for Developers
A label tells buyers that AI touched an image. It cannot tell your team which design revision supports the image, who approved its claims, where it is live, or how to withdraw it.

The New-Build Sales Platform Checklist
Two agents reserve the same unit from two laptops, both reservations go through, and the listing stays available for eleven minutes. Test one live unit through inventory, availability, attribution and discount approval before you choose a platform.

AI Search Is Shrinking the Click: What Property Developers Should Measure Instead
AI answers can remove the visit before it happens. Keep tracking search traffic, but judge it by what follows: qualified arrivals, unit exploration, contextual enquiries and reservations.