
AI Search Is Shrinking the Click: What Property Developers Should Measure Instead

Image co-authored with help of AI for illustrative purposes
Key Takeaways
- AI answers can reduce external clicks, so organic sessions alone no longer describe search visibility or demand.
- Measure the same four stages in a new way: visibility, qualified arrivals, unit exploration and reservation economics.
- A unit view, shortlist or contextual enquiry carries more sales meaning than another page view or minute on site.
- Cost per qualified buying sequence and cost per reservation connect search investment to sales progress.
The old search dashboard worked. It counted impressions, organic sessions, pages viewed and form fills. Those numbers told a property developer whether its pages were visible, whether searchers visited, whether they stayed and whether they raised a hand. They were cheap to collect, easy to compare month to month and good enough when a search result usually led to a page.
That dashboard remains useful, but it is now incomplete. AI answers can settle part of the research before a buyer reaches the development site. The visit that remains may carry more intent, less intent or simply a different question. You cannot tell from the click alone. Keep the four stages and make each one prove more.
Before: the search dashboard most teams already have
1. Visibility
Search impressions and average position. These show whether Google displayed the page.
2. Arrivals
Organic sessions and click-through rate. These show how often visibility became a visit.
3. Exploration
Pages per session, engaged sessions and time on site. These show whether visitors did more than bounce.
4. Outcome
Form fills, cost per lead and lead volume. These show how many visitors disclosed their contact details.
Why the old version earned its place
Each number answered a sensible question. Impressions exposed a visibility loss. Sessions showed whether a ranking produced traffic. Pages and time gave the marketing team a rough quality check. Leads gave paid and organic work a common outcome. None of that was foolish. Someone chose these metrics because the tools supplied them consistently and the buyer journey often passed through the website early.
The model also made planning simple. More useful pages could earn more impressions. Better titles could win more clicks. Better landing pages could turn more visits into leads. The chain was visible enough to manage. A monthly report could move from the search console to analytics to the CRM without changing the basic unit: a person clicked, visited and submitted.
AI search changes the first handoff. In Google's May 2026 account, AI Mode had passed one billion monthly users, and its query volume had more than doubled each quarter since launch. Those are Google-reported product figures, not an independent measure of buyer behavior. The independent warning comes from a Pew Research Center study of 68,879 Google searches made by 900 US adults in March 2025. Users clicked a traditional result after 8% of visits with an AI summary, against 15% without one. They clicked a source inside the summary in just 1% of visits.
That does not prove property search traffic will halve. The study covered US Google users, not off-plan buyers worldwide. It does prove that an answer layer can change whether research produces an external visit. A report that starts at the click can now miss a growing part of discovery.

After: the same four stages, with a harder test
The new dashboard keeps the same order and the same units where it can. It does not replace search reporting with a new acronym. It asks more of each row.
1. Visibility: keep total search impressions. Add impressions from generative search features, the pages shown there and the queries or themes those pages answer where the platform exposes them. Google rolled out a dedicated Generative AI performance report in Search Console in 2026. It reports impressions, pages, countries, devices and dates. Use it to see whether project facts and original research appear, not as a new vanity score.
2. Arrivals: keep organic sessions and click-through rate. Split arrivals into useful groups: branded search, non-branded project research, portals, campaign traffic and identifiable AI assistants. Then compare enquiry and reservation rates by group. Do not label AI referrals as better traffic until your own data shows it. Google says clicks from result pages with AI Overviews tend to spend more time on destination sites in its site-owner guidance. That is a platform claim and a hypothesis to test, not proof.
3. Exploration: keep pages and engaged time, but add actions that describe a property decision. Count distinct units viewed, repeat views of the same unit, filters used, floor plans opened, units compared, favourites saved and unit-specific brochures generated. Not every site has every action. Start with the interactions your site genuinely offers and name each event plainly.
4. Outcome: keep form fills and cost per lead. Add the share of enquiries tied to a specific unit or shortlist, enquiry-to-reservation rate, cost per reserved unit and time from first qualified visit to reservation. A lead is still useful. A lead with the unit, floor, price band and shortlist that produced it is useful to sales.
After: the same rows answer deeper questions
1. Visibility
Did search or an AI answer expose a fact the developer can stand behind? Track feature impressions and pages shown alongside ordinary search impressions.
2. Arrivals
Did the visitor reach a page that matches the question? Segment sources, then compare downstream quality.
3. Exploration
Did the visitor evaluate the product? Measure units, filters, floor plans, comparisons, favourites and return visits.
4. Outcome
Did the buying sequence reach sales with context, then a reservation? Report contextual enquiry rate and cost per reserved unit.
The scarce click has to reach a product, not another summary
A developer cannot recover every click that an answer layer absorbs. It can decide what happens to the click that arrives. Sending a buyer from an answer about two-bedroom homes to a generic homepage wastes the context the search engine just created. The destination should let that buyer inspect live two-bedroom inventory, compare relevant units and ask about one of them.
This is the difference between explanation and evaluation. Public text should make project facts clear enough to retrieve: location, stage, unit types, specification, availability policy, buying process and dates. The site should then do what an answer cannot do safely: show the development, let the buyer navigate its inventory and preserve a preference. Google's current guidance is refreshingly plain here. It says normal SEO still applies, pages need to be crawlable and indexed, and asks publishers to create "unique, valuable content." It rejects special AI markup and supposed GEO tricks as requirements for visibility.
The two jobs need each other. A beautiful unit selector with no crawlable facts is hard to discover. Fifty generic area guides with no path into live product give a buyer nothing to evaluate. The useful architecture is a factual discovery layer connected directly to a unit selector that carries the choice into the enquiry.
A practical measure: qualified buying sequences
A session is a technical container. A buying sequence is the product work inside it. Define one before you build the dashboard. For a medium or large development, a simple rule might be: a visitor reaches a unit list, views at least two units or returns to one, then compares, favourites, downloads a unit document or sends an enquiry tied to a unit. For a six-home project, viewing one house and opening its floor plan may be enough. The threshold should match the choice the project gives the buyer.
From that definition, three management numbers become possible:
- Qualified arrival rate: qualified buying sequences divided by arrivals from a source.
- Contextual enquiry rate: enquiries tied to a unit or shortlist divided by qualified buying sequences.
- Cost per qualified buying sequence: channel spend divided by qualified buying sequences.
These are proposed operating measures, not industry standards. Their value depends on whether they predict reservations. Run them beside cost per lead and cost per reserved unit for a full sales cycle. If a qualification rule does not separate future reservers from casual visitors, change the rule. A long session may mean interest or confusion. Ten unit views may mean a shortlist or a buyer who cannot narrow the field. Repeated views of B-207 plus an enquiry about B-207 carry a clearer meaning.
Do not compress every action into one mystery score. Show the actions below the summary number. A sales leader should be able to ask why a session qualified and see the unit trail that answers.
Where this is overkill
This method is not for every project. A six-home scheme with local buyers, one campaign and a salesperson who knows every enquiry may not need a new intent model. The sample will be too small to prove that a three-event sequence predicts reservations. Instrument the unit page and enquiry, then spend the saved time keeping prices and availability right. The same restraint applies to a development whose site does not let buyers choose between units. Adding ten analytics events to a brochure page does not create product intent.
AI visibility can also become its own vanity project. A consultant may offer a citation score, a generative-engine rank or a long list of prompts to monitor. Those checks can expose missing facts. They cannot show that a buyer evaluated a home or that marketing contributed to a reservation. If the team cannot connect an enquiry to a unit, fix that boundary before buying another discovery dashboard. A weekly report of one hundred tracked prompts is a poor substitute for that missing sales link.
The method earns its cost on developments with meaningful inventory choice, enough traffic to compare groups and a sales process that records downstream outcomes. The more units, sources and sales agents involved, the more valuable a shared definition becomes.
What changed for real, and what only changed in the report
The real change is that search can answer more before the visit. Pew observed lower external clicking when an AI summary appeared. Google has put AI search in front of a large mainstream audience. A developer should expect discovery to happen across a search result, an assistant, a portal, a social post and the project site, not in one neat sequence.
The first measurement artifact is source labeling. A buyer may learn about the development in an AI answer, later search the project name and arrive as branded organic traffic. Analytics records the final visible step, not the influence. An untagged link from an assistant may appear as direct traffic. Do not claim AI created demand because an AI referrer appears, or claim it did nothing because it does not. Ask buyers how they found the project on the enquiry form, keep the options short and compare that answer with technical attribution.
The second artifact is visibility without a comparable click. Generative impressions are useful, but they do not mean the same thing as a classic result at position three. Treat the new Search Console report as its own series. Do not splice it into an old chart and call the jump growth.
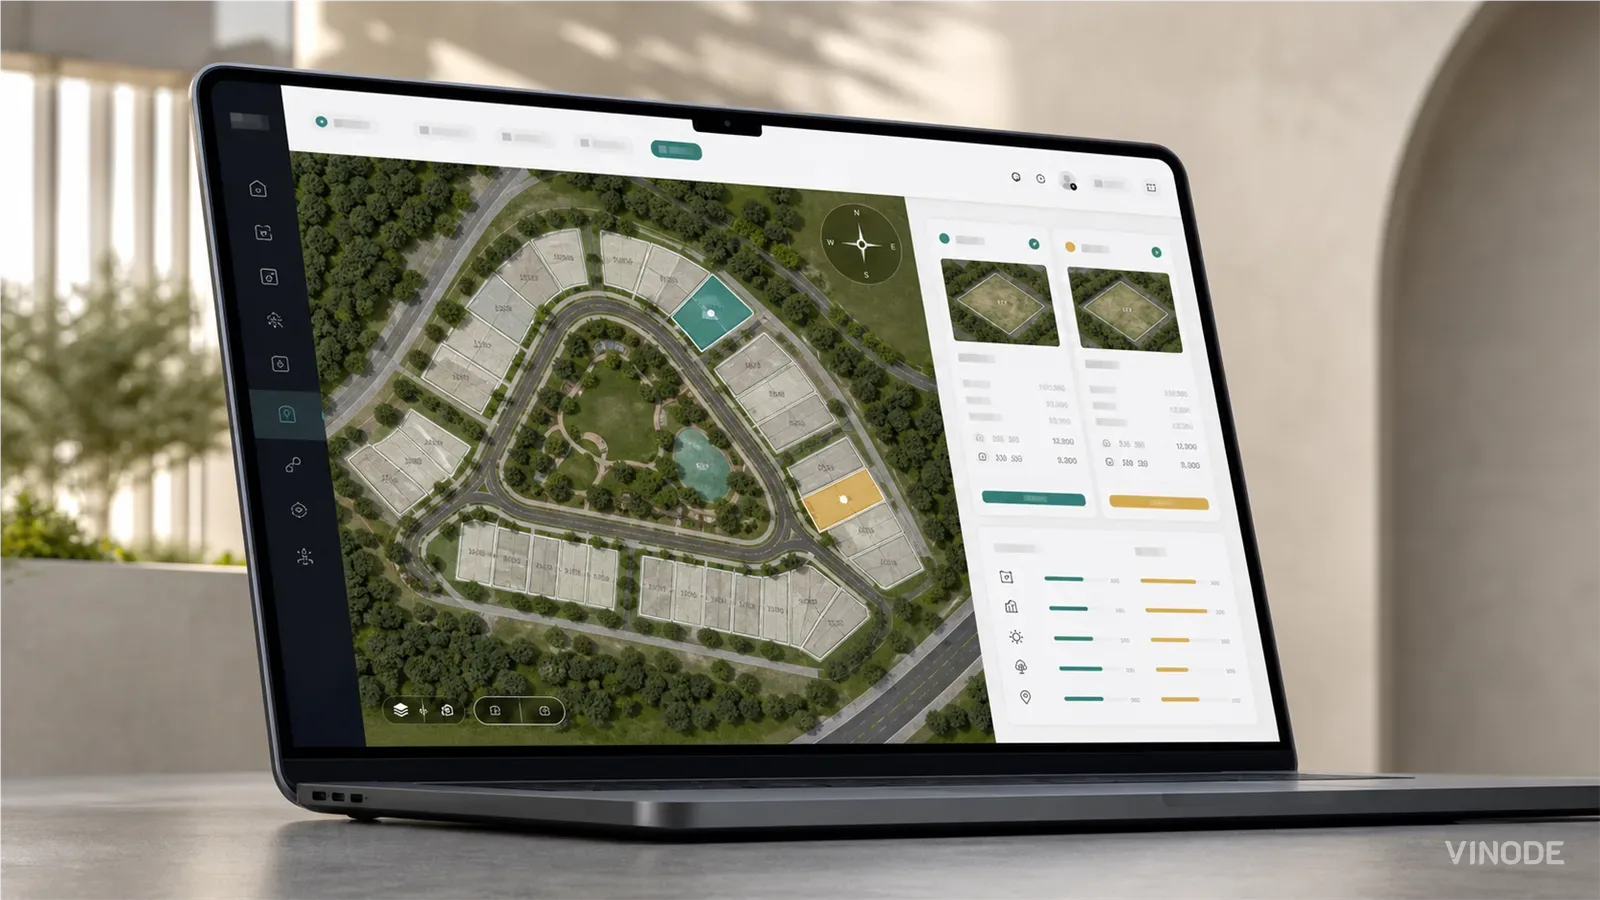
The third artifact is intent inflation. A filter click is not a qualified buyer by itself. A returning visit is not a reservation. Vinode's back panel can connect a lead to the units viewed and time spent, while project experiences can offer filters, favourites, comparisons and unit-specific PDFs. The exact event plan still has to be configured and tested for the project. We should not turn every interface action into a product claim or a sales score before the data earns it.
The dashboard to put in front of leadership
Keep one page. Four rows, from visibility to outcome. Show this month, the trailing quarter and the same period last year where the definitions match.
- Visibility: ordinary search impressions; generative search impressions; project pages shown.
- Qualified arrivals: sessions by source; branded versus non-branded; qualified arrival rate.
- Product exploration: distinct units viewed; repeat unit views; comparisons, favourites and unit documents; return rate.
- Reservation economics: contextual enquiries; enquiry-to-reservation rate; cost per qualified buying sequence; cost per reserved unit.
Under every number, show its definition and the date the definition changed. Under every source split, show the share that could not be classified. That small discipline stops a dashboard redesign from masquerading as buyer behavior. It also keeps traffic in its proper place: a diagnostic input to the connected off-plan marketing system, not the result.
Something did get worse in the move from the old dashboard to this one. The clean story disappeared. Impressions no longer lead neatly to clicks, clicks no longer reveal the whole discovery path and one form fill no longer says much about purchase intent. The new report takes event design, CRM discipline and patience through the sales cycle. It is harder to explain in a board meeting. It is also closer to how buyers now find and choose a home.
Pick one development and one quarter. Define a qualified buying sequence, connect unit context to each enquiry and compare its reservation rate with all other sessions. Keep the rule only if it predicts a commercial difference.
Turn a search visit into a unit-level decision
See how Vinode connects interactive project exploration, live unit data and contextual enquiries.

How buyers pick a plot on a housing development they have never walked on
On a six-house estate a clickable plot map does the whole job. On a varied estate the buyer still calls to ask which way the garden faces and what is behind the fence. What a plot finder has to show so that call becomes a reservation, and who at the developer keeps it current.

How to commission a development flythrough (and what to measure)
A sales director is asked by his board which reservations the launch film brought in, and cannot name one. What a flythrough can actually do, how to commission it so a later design change is one re-rendered shot, and what to measure instead of views.

Cost per lead vs. cost per reserved unit: the two numbers that defend a marketing budget
A slide with two cost-per-lead figures lost a marketing manager a third of her budget. Below a 2% lead-to-reservation rate, cutting cost per lead barely moves what each reserved unit costs, and cost per reserved unit is the number a board will fund.