
Core Web Vitals for property sites: how to actually measure a 3D tour's impact
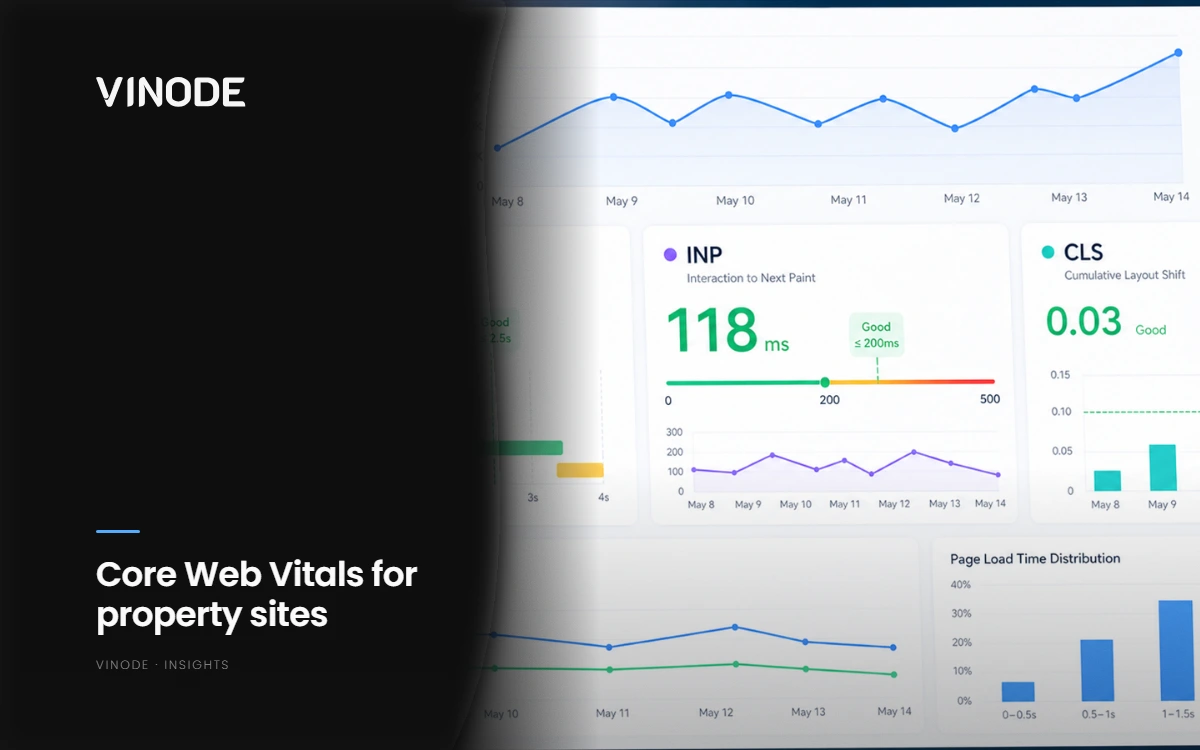
Key Takeaways
- Lighthouse cannot score INP, the field-only metric a heavy 3D tour tends to break first.
- Judge a tour by its field data at the 75th percentile: LCP 2.5s, INP 200ms, CLS 0.1.
- A new page shows "No Field Data" because CrUX needs weeks of Chrome traffic and falls back to a domain-wide average.
- CrUX excludes in-app browsers, so leads who open your tour from a social link may go unmeasured.
Someone on the sales team runs PageSpeed Insights on the new development page, sees a green 96 on the desktop tab, and forwards it round as proof the 3D tour is fine. A week later marketing runs it again from a launch link and the same page reports "No Field Data," which reads like an error. Two people, one tool, opposite conclusions. The reason is that PageSpeed Insights stacks two different measurements in one report, and neither is the one most people think they ran.
Lab and field are two different measurements
The top of a PageSpeed Insights report is a Lighthouse lab test: one load, in a Google data centre, on a simulated device and throttled connection. It is reproducible, and it is synthetic. Nobody was there. The bottom of the report, when it appears, is field data from the Chrome User Experience Report (CrUX), which is what real Chrome users on real devices actually recorded when they opened your page.
The two answer different questions. Lab answers "can this page be fast in a clean room?" Field answers "was it fast for the buyers who actually loaded it?" A tour page can pass the first and fail the second, because your buyers are on a mid-range Android on hotel wifi, well short of Google's reference machine. My rule after enough of these audits is to treat the lab score as a diagnostic instrument and let the field data be the report card. Judge the tour by what real devices recorded, and open Lighthouse only to reproduce a problem the field already flagged.
The metric Lighthouse can't score
Here is the load-bearing fact. Interaction to Next Paint (INP) captures how sluggish the page feels when a buyer taps, drags, or opens the tour, and it has no lab score at all. Lighthouse cannot produce an INP number, because INP measures real interactions and a lab run interacts with nothing. Google documents that INP is measured in the field, not in the lab, and PageSpeed Insights only ever shows it under the field-data section.
That matters more for a 3D tour than for almost any other page. A tour's real cost lands later than first paint, in the main-thread work the moment someone starts interacting. So the single number most likely to expose a heavy tour is the exact number a green Lighthouse score never contains. I have seen tour pages score 95 in the lab and still deliver a visibly laggy tap on a mid-range phone, which is precisely the gap INP exists to catch.
INP replaced First Input Delay as a Core Web Vital on 12 March 2024. FID is retired. A dashboard or audit still quoting FID is describing a metric Google no longer counts, so treat its verdict as stale.
Read the 75th percentile, not an average
Field tools do not report your average visitor. They report the 75th percentile: the experience at least three-quarters of your page views were as good as or better than. It is deliberately unforgiving. To pass, the slower quarter of your real traffic has to have a fast experience too, not just the median device in a spec sheet. An average would quietly bury exactly the struggling phones a heavy tour tends to punish, which is why p75 is the honest number to hold a launch to.
The three thresholds, at p75
LCP - loading
Largest Contentful Paint at or under 2.5s. When the biggest thing on screen finished painting.
INP - responsiveness
Interaction to Next Paint under 200ms. Field-only - the tap-latency number a 3D tour is likeliest to move.
CLS - stability
Cumulative Layout Shift under 0.1. How much the layout jumps as the tour and its container load in.
Thresholds and metric names are current as of this writing (2026-07-04). Google publishes the definitions and cut-offs and revises them periodically, so re-check before quoting them in a spec.
"No Field Data" is not an error
The most confusing result on a new development page is field data that simply isn't there, and it is usually the tool working correctly rather than a fault. Two things cause it.
First, the 28-day window. CrUX aggregates a rolling 28 days of Chrome traffic, so a page that launched last Tuesday has almost no history to report yet. A Safa Al Fursan-scale page (528 units, a heavy tour) can be live and healthy and still show nothing for weeks, simply because too few visitors have loaded it over a long enough stretch.
Second, the too-few-samples fallback. CrUX only reports a specific URL once it has enough samples to be statistically stable. Below that bar, PageSpeed Insights falls back to origin-level data, the whole domain's numbers averaged together, or shows nothing at the page level. So a green field score on a brand-new URL might actually be your entire site's average dressed up as the tour page's. Read the label. Page-level and origin-level are not the same claim, and conflating them is the most common way I see a launch page misread.
PageSpeed Insights labels the field section with the scope it found. If it reads something like "showing origin data" or the URL toggle is greyed out, you are looking at the whole domain, not the tour page - wait for page-level samples to accumulate before you conclude anything about the tour itself.
The buyers CrUX never sees
Field data is not everyone. CrUX collects only from Chrome users who meet its conditions, and it excludes Chrome on iOS, Android WebView, and other Chromium-based browsers. For a property launch, the expensive gap is the in-app browser.
A lead who taps your tour link inside Instagram or WhatsApp opens it in that app's embedded WebView, not in Chrome proper, so their experience may never reach CrUX. The exposure tracks your channel mix. A development that drives most of its launch traffic through paid social and broker DMs can have a third or more of its real tour opens land outside CrUX entirely, while a project selling mostly through organic search and email sees almost all of its opens counted. Green CrUX does not mean every buyer had a fast tour; it means the Chrome-eligible subset did. When social is a primary channel, I would not trust CrUX alone; add real-user monitoring in your own analytics so the in-app opens are counted.
This workflow is not for every page. It earns its keep on a heavy, interaction-rich tour where INP is a genuine risk. If your page is a light gallery of photos and a floor-plan PDF, the field-versus-lab distinction barely matters and a plain PageSpeed run tells you most of what you need. The exception that justifies the rigour is the launch that stakes real ad budget on a streamed 3D experience.
Attribute before you blame the tour
A bad field number is a starting point, not a verdict. Before anyone concludes the tour is the problem, map the failing metric to a cause. A slow LCP, a janky INP, and a jumpy CLS each come from different failure modes; the companion post on which failure hits which metric walks that mapping, and where the 3D is rendered (pre-rendered and streamed versus computed on-device) changes the answer.
One honest flag. Vinode's own stated figures, roughly two-second loads and offline-kiosk playback, are the platform's numbers, earned through continuous engineering work on performance, rather than an independent lab result. Hold them to the same bar you would hold any vendor's claim, and verify them yourself in the field.
A measurement checklist for a real page
Point your tools at an actual tour page, for example /projects/safa-al-fursan, and read it in this order:
- Field first. In PageSpeed Insights, read the CrUX section before the Lighthouse score, and confirm it is page-level rather than origin-level.
- Check p75 against the three thresholds. LCP <= 2.5s, INP < 200ms, CLS < 0.1. INP is the one to watch on a tour.
- If you see "No Field Data," note the launch date. A page under about four weeks old simply has no window yet, so come back later instead of panicking.
- Cross-check social traffic. If leads arrive via Instagram or WhatsApp links, add real-user monitoring, because CrUX won't count those in-app opens.
- Only then open Lighthouse, to reproduce and diagnose a problem the field already surfaced. It is the last step, never the verdict.
Measure a live tour on your own device
Open a real Vinode project, run it through PageSpeed Insights yourself, and read the field data on a live, streamed property tour firsthand.

Masterplan 3D for Phased Estates: How to Show Phase One Without Overselling Later Phases
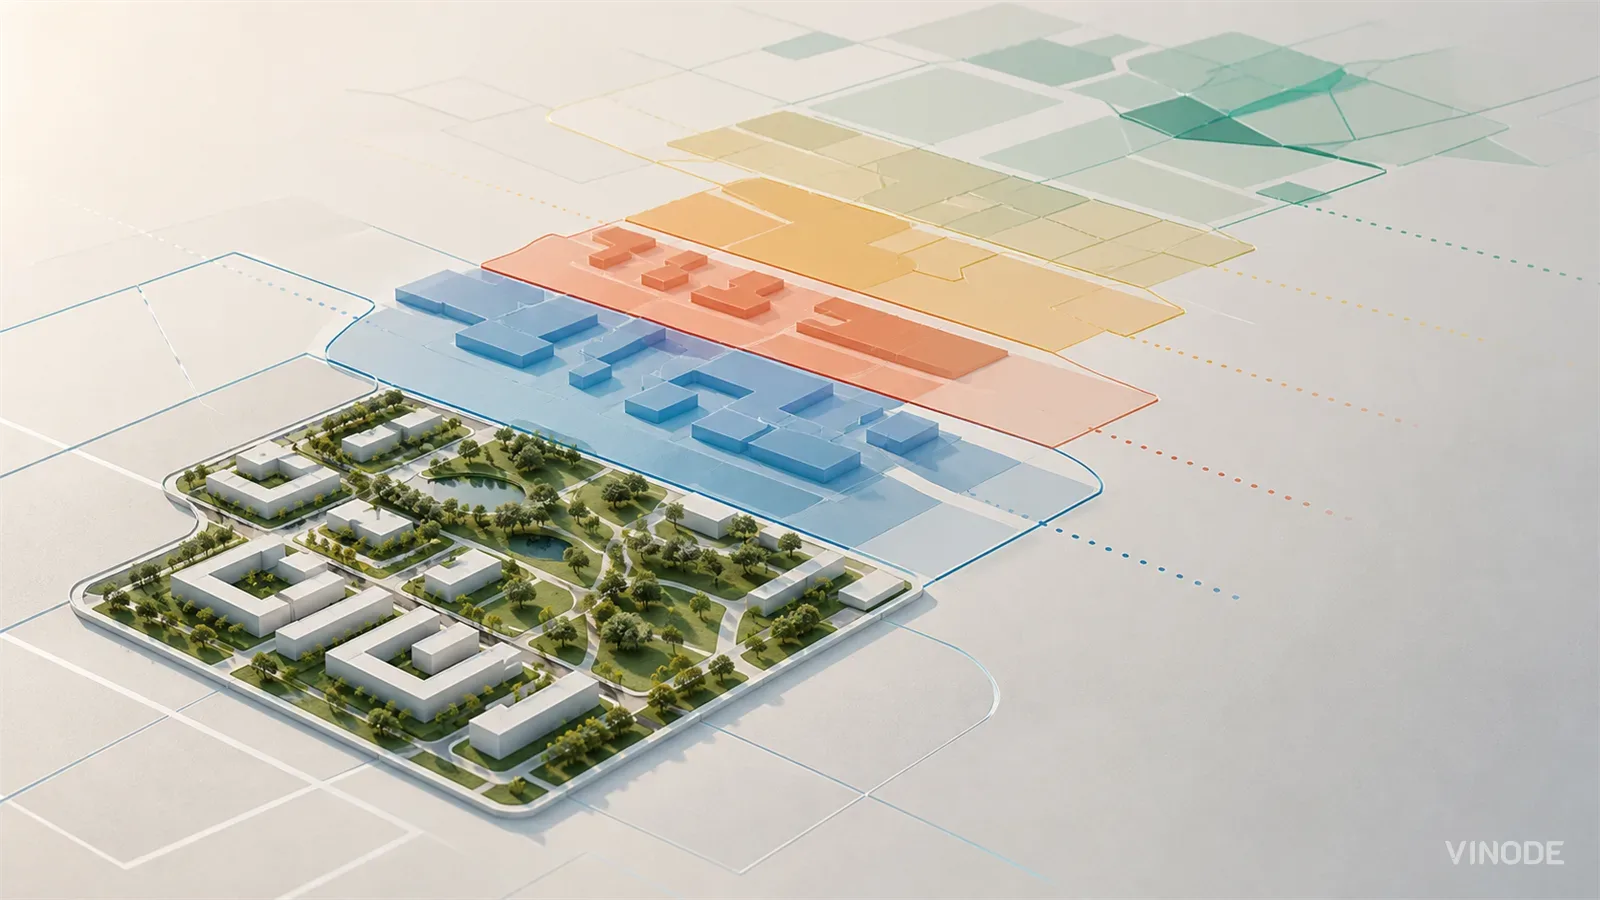
A phased estate contains several levels of certainty at once. The masterplan should make that difference visible, then absorb a later-zone redesign without discrediting the phase-one material buyers already saw.

Why rendered glass façades read as fake: the optics of IGU deflection
Archviz glass reads as fake for a reason no roughness slider reaches. Real curtain-wall panes are slightly bowed, each one differently, so adjacent panes reflect the sky at slightly different angles. A render's panes stay flat because the CAD geometry is flat, and that flatness is what the eye catches.
Off-Plan Rendering: What Reaches the Buyer
A new marketing manager inherits 140 JPEGs, one MP4 and no model. Everything the 3D model knew about the units stayed on an artist's workstation, and three vendors are about to rebuild it by hand. What reaches the buyer depends on what leaves the studio.