
Do 3D property tours hurt Core Web Vitals? Diagnose it yourself before you ship
Key Takeaways
- Map each failure mode to one metric: a heavy payload pushes out LCP, a long main-thread task costs INP, an unreserved container triggers CLS.
- Attribute the cost yourself with a Chrome DevTools performance trace and the network panel while you pan and tap on a mid-range phone.
- A single plain YouTube embed ties up the main thread for over 1.7 seconds; a live 3D engine in an iframe behaves the same way, heavier.
- Bounce rate is not a Google ranking factor; Core Web Vitals feed page-experience signals but are weighed among many factors, not decisive alone.
The tour looked perfect in the review meeting. Someone opened it on a laptop plugged into the office monitor, the camera swept over the development, and the room agreed it was the thing that would sell the launch. Two weeks later the same marketing lead is staring at a PageSpeed Insights report for the page it will live on, and the mobile score is a number nobody wants to walk into the head of digital's office holding. The worry is real but blurry: that the immersive experience they championed is about to drag the page's Core Web Vitals down.
"3D is heavy" is where most of these conversations stop, and it is not a diagnosis. Core Web Vitals are three separate measurements, and a heavy tour hits each one for a different, nameable reason. This article is about doing that attribution yourself: matching each failure mode to the metric it damages, then confirming it on your own page with a Chrome DevTools trace and the network panel before you embed anything. If you have already settled on an interactive 3D tour and just need to know what it costs on mobile, this is for you; whether a tour is worth having at all is a different article.
One architectural fact sets the ceiling on all of this, and it is worth naming once before the diagnosis. A tour either renders its frames on the buyer's phone (a WebGL walkthrough, a Unity embed, a live pixel-streaming iframe) or it plays back frames rendered in advance on hardware you control, the way any site serves a video. On-device rendering lands the graphics work, the main-thread JavaScript and the heavy download on the device you least control. Playback does not. That is the single variable behind every metric below, and the full case for why pre-rendered wins on mid-range mobile lives in its own post: why pre-rendered 3D beats real-time in the browser. The rest of this article assumes you want to measure the cost on your specific page rather than take that argument on faith.
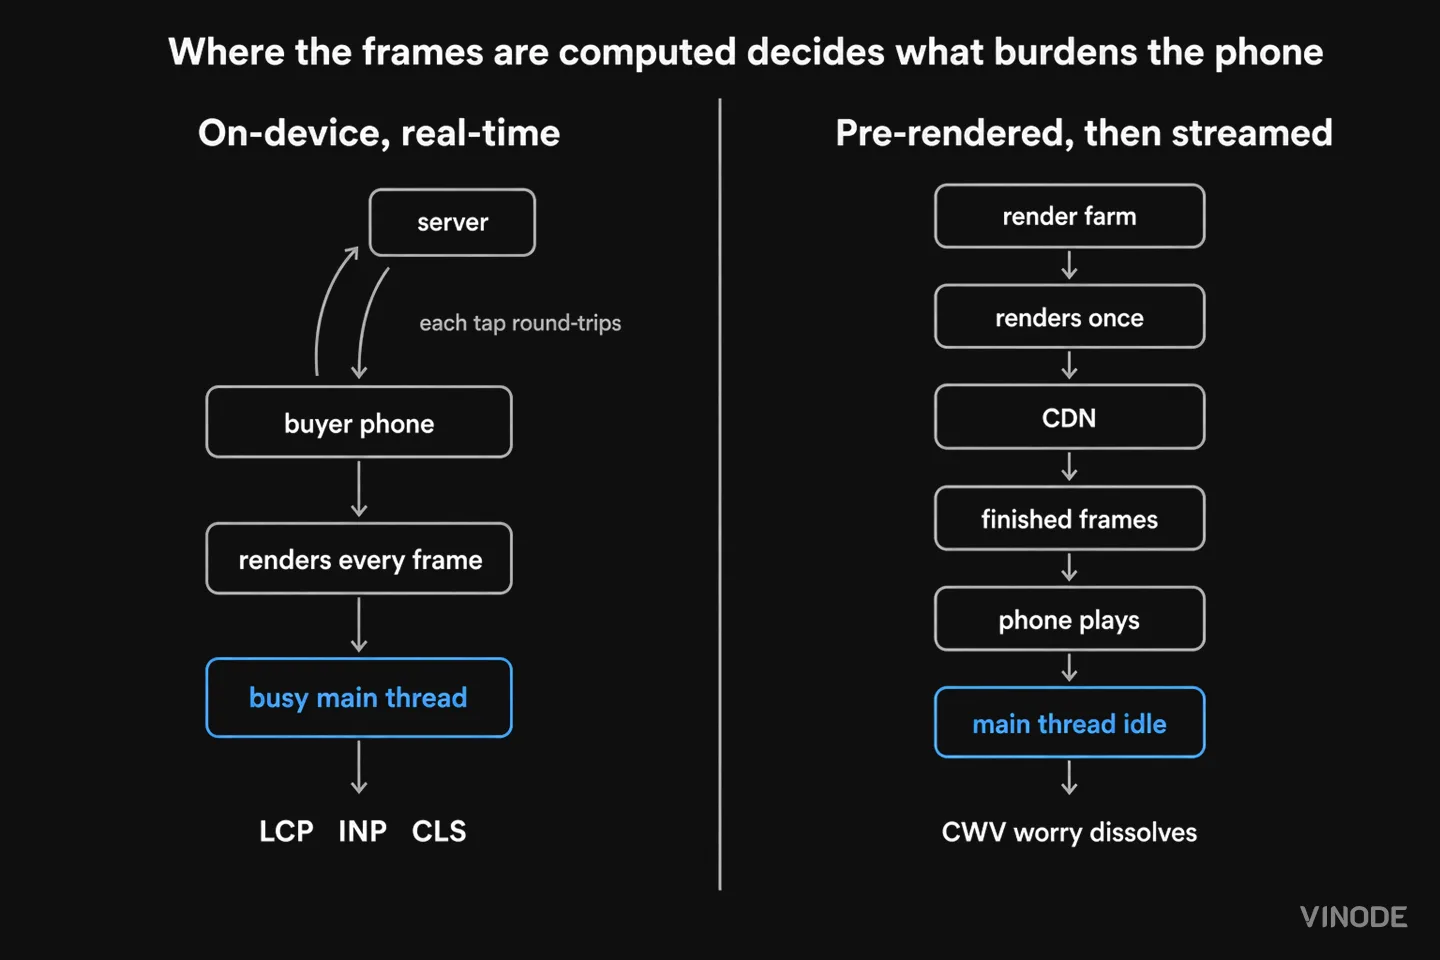
Which Core Web Vital each 3D-tour failure mode hits
Start with the three metrics themselves. Google judges a page at the 75th percentile of real visits against three thresholds: Largest Contentful Paint (loading) at 2.5 seconds or under, Interaction to Next Paint (responsiveness) under 200 milliseconds, and Cumulative Layout Shift (visual stability) under 0.1 (web.dev - Web Vitals).
Map a tour's failure modes onto those three and the vague heaviness becomes specific, one cause per metric:
- A live 3D engine ships a large initial payload of geometry, textures and runtime, which pushes out LCP.
- That engine's JavaScript runs on the browser's main thread, and the main thread handles one task at a time. Any task that runs longer than 50 milliseconds is a long task that blocks the page from answering a tap (web.dev - optimize long tasks), and that is where INP is won or lost.
- An embed dropped in without a reserved, correctly sized container shoves the rest of the page down as it loads, and that is a CLS hit.
One embed, and for that whole stretch the page cannot react to a tap. web.dev measured the median embed blocking the main thread for more than 1.7 seconds (web.dev - embed best practices).
The "just embed it like a YouTube video" myth
Two things date a tour vendor's performance pitch. The first is FID. Interaction to Next Paint replaced First Input Delay as a Core Web Vital on 12 March 2024 (web.dev - INP is a Core Web Vital), so any page still promising good FID is describing a metric Google has retired. INP is the harder bar to clear, because it grades the responsiveness of real interactions across the whole session, where FID only ever graded the first tap.
The second is the reassurance itself. "Embed it like a YouTube video" sounds safe because video feels like a solved problem. But the number in the box above is a plain YouTube embed doing exactly that, and it still froze the main thread for over a second and a half. An iframe running a vendor's live 3D engine behaves the same way, heavier. The move sold as the settled, low-risk way to add a tour is the one that manufactures the INP problem.
Run a DevTools trace on your own tour, on a mid-range phone
The mapping above tells you what to look for; a trace tells you whether your specific tour is doing it. Record a performance trace in Chrome DevTools while you pan and tap the tour on a mid-range phone, and read it against the three metrics directly. Long tasks stacked on the main thread during interaction are your INP problem made visible. A slow, heavy first paint is the LCP cost. Content jumping as the embed loads is the CLS hit. Watch the network panel at the same time: a live engine pulls megabytes of geometry, textures and runtime, while a streamed tour behaves like a video download and then goes quiet. The phone itself is a third tell, since sustained GPU work heats the device and drains the battery in a way playback does not, the same ceiling that decides whether a tour survives the weakest phone that opens it. And if you would rather not test at all, ask the vendor plainly where the frames are computed, since that answer predicts the whole trace.
What you do next follows from the trace. If the main thread is full of long tasks during interaction, expect an INP cost plus a likely LCP and CLS cost on mid-range mobile, and treat mitigation as build work from day one. If the trace stays mostly idle, the rendering cost is not reaching the phone; you still confirm the container is sized and a poster is set, since a carelessly embedded video can shift layout too, but you are no longer fighting the main thread on every interaction. For the deeper version of the load-time and device-reach argument, see how large developments stay fast in the browser.
Treat these mitigations as part of the build from the start. Lazy-load any offscreen iframe so it is not fetched until the buyer scrolls near it (web.dev - lazy-load iframes). Replace the live embed with a click-to-load facade: a static poster that swaps in the real thing only on interaction (web.dev - facades). Reserve a correctly sized container so nothing jumps. And say the cost aloud, because a facade is not free: the tour does nothing until the visitor clicks, and web.dev notes autoplay may not fire on a lazily loaded embed. That is a real tradeoff, worth accepting on purpose rather than discovering in production.
What a passing trace looks like on a streamed tour
The trace and network panel are also how you confirm a streamed tour actually clears the bar, not just that an on-device one fails it. When the frames were rendered upstream, the page ships only a video-weight payload and the main thread stays mostly idle through pan and tap, which is what a clip like the one below is doing on a phone. Vinode's own pages load in about two seconds and run on low-powered and older phones, and in kiosk mode they run offline; those load-time and offline figures are Vinode's own, a property of how the platform is built rather than an independent lab measurement of any one project.
Bounce rate is not a ranking factor; Core Web Vitals are one of many
One more worry usually rides in with the speed one: the claim, everywhere in vendor content, that a 3D tour lifts your ranking by lowering bounce rate and raising dwell time. Drop the bounce-rate half of it. Bounce rate as your analytics tool reports it is not a search ranking factor: it is a number your own tooling computes rather than a signal Google receives, and it appears nowhere in Google's published ranking guidance. The belief survives because it sounds intuitive.
What is real is narrower, and worth stating precisely, because precision is what lets you defend the decision internally. Core Web Vitals feed Google's page-experience signals, which have been part of ranking since 2021, but Google is explicit that there is no single decisive signal and that page experience is weighed among many factors against the relevance of your content (Google Search Central - page experience). Passing Core Web Vitals is genuinely worth doing, and it will not vault you up the results on its own. So a fast, immersive page pays off in the buyers it converts once they arrive, and treating Core Web Vitals as a ranking lever oversells what the signal actually does.
The 'pays off in conversion' half isn't hand-waving. Two controlled A/B tests isolated paint speed: Rakuten saw +33% conversion and +53% revenue per visitor, and Vodafone +8% sales and a +15% lead-to-visit rate (web.dev - Rakuten; Vodafone).
Source: web.dev - Rakuten 24 case study - as of
What pre-rendering costs you: free-roam and live interactivity
Pre-rendering is not free of every cost, and pretending otherwise would be its own kind of vendor slop. You give up true free-roam and live, unbounded interactivity: the buyer moves through a designed set of views and options rather than steering an open world in real time. For most residential sales, where the choices are a finite, known set of units and finishes, that reach and speed are worth the constraint. If your use case genuinely needs live, open-ended interaction, then you are choosing the on-device cost with open eyes, a legitimate call as long as you budget the mitigations that come attached to it.
That is the decision actually in front of you once the tour itself is settled. Make it deliberately, sized to the hardware your buyers carry, and you will know precisely what your performance budget is buying. This diagnosis runs before you ship; once the page is live, the companion post on measuring a 3D tour's Core Web Vitals in the field covers the CrUX data that tells you whether the budget actually held with real buyers.
Test it on your own worst phone
Open a live Vinode project on the least capable device and the flakiest connection you can find. That is the environment your buyers will actually open it in.


Masterplan 3D for Phased Estates: How to Show Phase One Without Overselling Later Phases
A phased estate contains several levels of certainty at once. The masterplan should make that difference visible, then absorb a later-zone redesign without discrediting the phase-one material buyers already saw.

Why rendered glass façades read as fake: the optics of IGU deflection
Archviz glass reads as fake for a reason no roughness slider reaches. Real curtain-wall panes are slightly bowed, each one differently, so adjacent panes reflect the sky at slightly different angles. A render's panes stay flat because the CAD geometry is flat, and that flatness is what the eye catches.

Off-Plan Rendering: What Reaches the Buyer
A new marketing manager inherits 140 JPEGs, one MP4 and no model. Everything the 3D model knew about the units stayed on an artist's workstation, and three vendors are about to rebuild it by hand. What reaches the buyer depends on what leaves the studio.