
What Off-Plan Buyers Do Before They Enquire: A Vinode Benchmark

Image co-authored with help of AI for illustrative purposes
Key Takeaways
- About 29% of identified sessions across Vinode-hosted developments came from returning visitors.
- On one anonymous development, returning sessions lasted about 1.9 times as long as new sessions.
- Unit and filter context gives sales the buying choices behind each enquiry.
- Predictive lead scoring should wait until clean event data connects browsing to enough enquiries and reservations.
The minimum useful off-plan buyer benchmark needs four facts: whether visitors return, how long they stay, which units they inspect, and whether that activity reaches an enquiry. Build a clean path from an anonymous visit to a named lead. Keep project differences and missing data visible. Save predictive scoring for later.
The minimum benchmark: return, depth, unit, enquiry
Start with four rows, one per signal. Report them by development and period before combining anything across a portfolio.
- Return rate: the share of identified sessions marked as returning.
- Session depth: time and page views for new and returning sessions.
- Unit exploration: distinct unit pages opened, plus repeated views where tracking allows it.
- Enquiry connection: the unit, filters, and page that were active when the visitor submitted a form.
Across Vinode-hosted developments, 26,218 of 89,736 sessions identified as new or returning were returning sessions, about 29%. Another 12,862 sessions had no new-versus-returning value and were excluded from that rate. This company-measured GA4 dataset runs from July 2024 through July 2026. Its scope is the developments measured here.
26,218 returning sessions out of 89,736 identified sessions across hosted developments. A further 12,862 sessions had no value and were excluded.
Source: Vinode measurement - as of
That return rate makes a hidden part of the buying process visible. A form records the moment a visitor chooses to identify themselves. Many sessions happen earlier. Several questions remain open: the same person may use another browser or device, and a return does not establish why an enquiry happened. Cookie choices and measurement rules limit the match.
These four rows still change the discussion. Teams can see repeat consideration and separate it from immediate form submission. Marketing and sales also gain one shared question: what did the visitor narrow down before asking to speak?
First addition: record unit-level exploration
The first addition is an event record for the property hierarchy: development, zone, building, floor, and unit. It buys a sharper description of intent than raw dwell time. Five minutes could mean careful comparison or a browser tab left open. Opening a two-bedroom filter, viewing three units, and returning to one of them gives the time a subject.
One anonymous development recorded visits to 76 distinct pages inside a single building, including more than 70 individual apartment pages. The zone view drew 3,475 sessions and 13,067 page views, about 3.8 views per session. Sessions averaged about 4.7 minutes. People used the drill-down. The later enquiry link remains unmeasured.
This addition costs more than placing analytics on a homepage. Event names must stay stable when the interface changes. Unit IDs must match the inventory. Test traffic and internal visits need filtering. A page view also needs its place in the hierarchy; otherwise, the report fills with cryptic URLs. The unit-selection UX guide explains the visible hierarchy. The benchmark needs its data side.
One anonymous development, measured over two years. The finding shows real drill-down use, not later conversion.
Source: Vinode measurement - as of
Second addition: separate first visits from return visits
The second addition connects sessions well enough to compare first and later visits. In one project sample, returning sessions averaged 402 seconds, about 6.7 minutes. New sessions averaged 217 seconds, about 3.6 minutes. The ratio was 1.9 to one.
Causality remains unknown. People with stronger prior interest may be more likely to return. Campaign source, device, project type, price, and inventory can also change the pattern. Two anonymous developments on the same platform averaged about 3.6 and 6.7 views per session. Across four projects, engaged-session rates ranged from about 40% to 75%. Blending those projects would bury the spread.
The cost of this addition is identity restraint. Keep anonymous analytics anonymous. Ask for consent before joining activity to a named CRM record. Treat cross-device activity as separate unless the buyer provides a lawful connection. Once a visitor submits, carry useful context into the lead: the project, last unit viewed, selected filters, and the page that produced the enquiry. Our guide to property lead forms covers the form itself. This benchmark covers the context that travels with it.
About 6.7 minutes versus 3.6 minutes on one anonymous development. This is a consideration signal, not a causal conversion result.
Source: Vinode measurement - as of
Third addition: join the path to the enquiry
The third addition links browsing context to a lead and then to a booked viewing or consultation. Now sales can open with the units the buyer already compared. Marketing can see whether a campaign creates shallow visits or specific buying sequences.
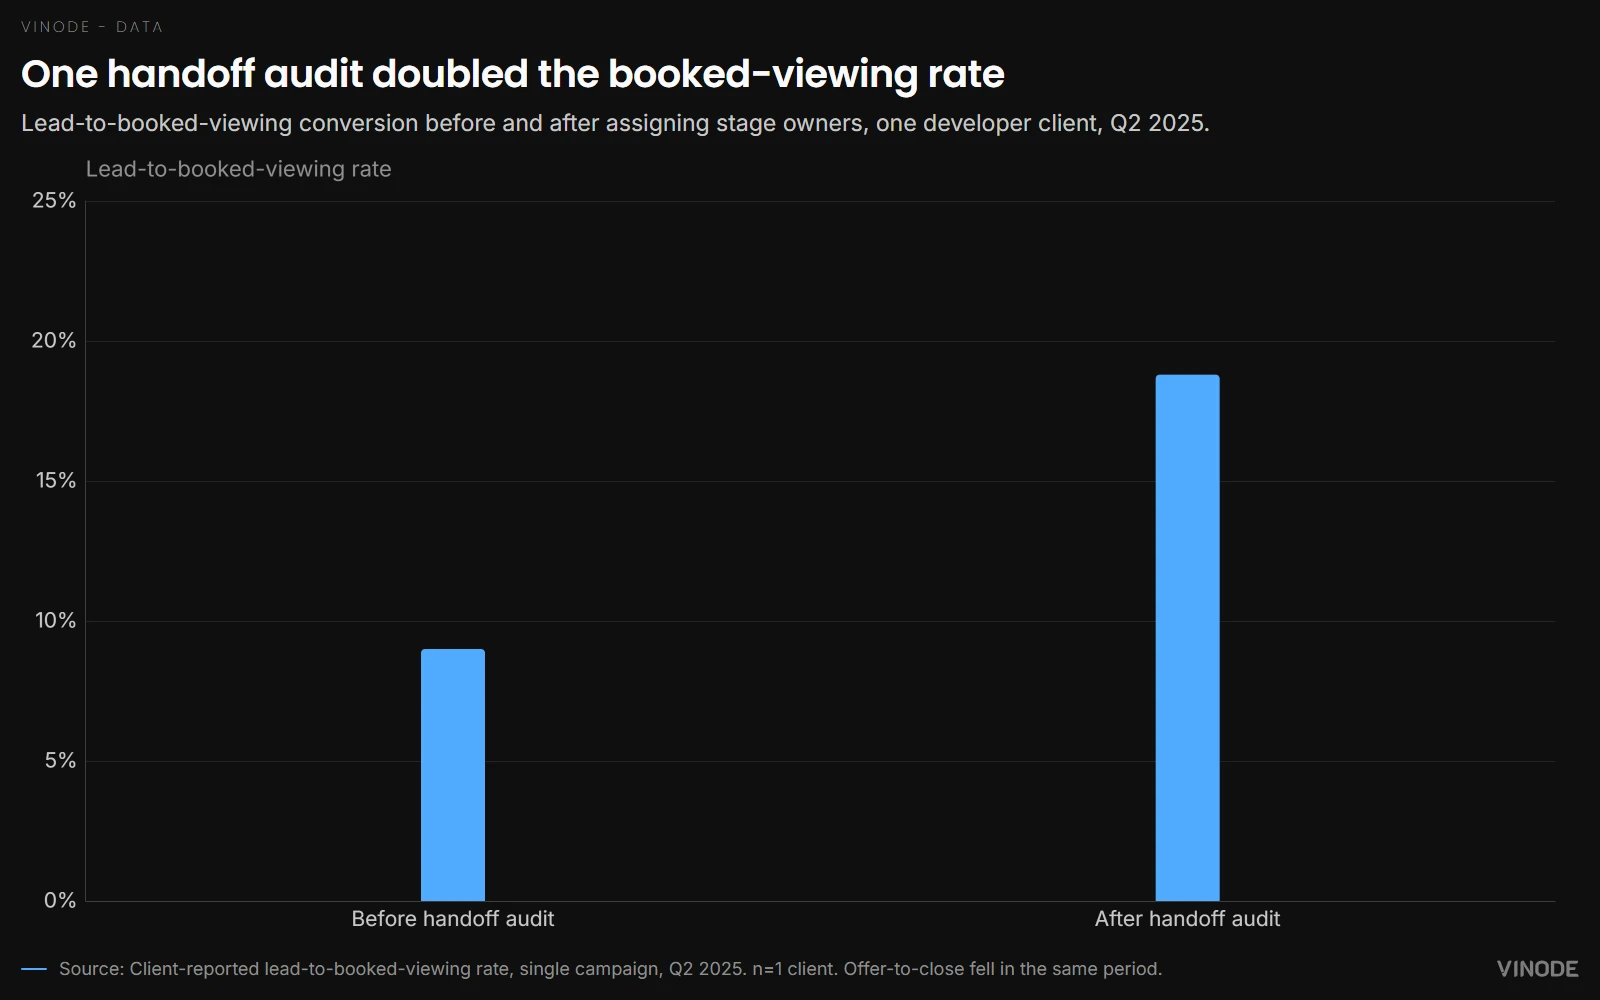
One developer client reported a visitor-to-lead rate of 1.2% before switching its presentation to Vinode and 2.8% after, a 133% relative increase. Among visitors who reached a property detail page, lead conversion moved from 4.0% to 6.7%. Lead-to-booked-viewing moved from 9.0% to 18.8%. This covered one development and one campaign. The client supplied stage rates without absolute counts. The comparison says nothing about the prior platform and cannot isolate Vinode as the cause.
The case supports following the path beyond the form. It cannot set an expected lift for another project. A lead total also leaves the buyer's shortlist and later meeting hidden. The fuller account sits in where off-plan buyers start online.
The rate moved from 1.2% to 2.8% on one development. One campaign, n=1, before and after the switch; not a controlled trial.
Source: Vinode measurement - as of
The GA4 findings cover different anonymous development samples between July 2024 and July 2026. The return rate excludes sessions with no new-versus-returning value. The 1.9x duration finding and the 70-plus unit-page finding each come from one anonymous development. Project, channel, device, price, and audience mix differ. The client funnel is a separate client-reported before-and-after case. None of these observations proves that a specific interface action caused an enquiry or reservation.
What one row in the benchmark actually represents
A benchmark becomes dangerous when its denominator disappears. To be precise, the 29% figure is not 29% of people and it is not 29% of buyers. It is the returning share of sessions for which GA4 supplied a new-or-returning value. One person can create several sessions. The same person on another device may look new. A shared tablet in a sales office may represent several people. Consent choices can remove the identifier entirely.
That is why the unknown count belongs beside the percentage. There were 12,862 sessions without the classification. Hiding them would make the result look cleaner and the measurement less honest. The useful reporting line is therefore: 26,218 returning sessions out of 89,736 classified sessions, with 12,862 unclassified sessions shown separately. A board can see both the signal and the measurement boundary.
The unit of analysis changes as the path moves forward. At the top, the unit is a session because the person is anonymous. After a consented form submission, the unit can become a lead. Once the CRM records a viewing or reservation, the unit becomes a commercial outcome. Do not silently join these levels. Keep the keys that make the link possible, then state how many records matched and how many did not.
This sounds like a technical detail, but it changes the question. A session report asks how the site was used. A lead report asks what known prospects did. A reservation report asks which earlier actions appeared in successful journeys. They are related views of the same funnel, not interchangeable totals.
Do not turn this into a league table
The portfolio spread is the finding most likely to be misused. One development produced about 3.6 page views per session and another about 6.7. Engaged-session rates across four projects ranged from about 40% to 75%. It is tempting to rank the projects, congratulate the top one, and ask the bottom one to copy its interface. That conclusion arrives before the evidence.
A project with six large homes gives a buyer fewer pages to open than a 300-unit estate. A returning buyer may reach the right apartment in two views because the shortlist is already clear. Paid social traffic can bring broad early interest, while branded search can bring people who know the project. Price, geography, release stage, campaign promise, stock depth, device mix, and the number of genuine choices all affect the observed path.
Worth a small digression: many analytics reports reward motion. More pages, more clicks, and more time look active, so they acquire the status of success. A confused buyer can produce all three. A person who opens the correct unit, checks the floor plan, and sends a contextual enquiry in ninety seconds may be the better visit. Anyway, going back to the benchmark, the job is not to maximize activity. It is to learn which activity carries the decision forward.
Compare a development with itself first. Hold event definitions stable, annotate campaign and inventory changes, and read several periods together. Compare projects only after segmenting obvious structural differences. The portfolio can supply hypotheses. It should not supply a universal target such as five pages per session or six minutes on site.
Four hypotheses worth testing before a lead score
Return versus first visit
Compare contextual-enquiry and reservation rates by visit number. Keep the unknown identity group visible.
Breadth versus time
Test whether distinct units viewed explains later action better than dwell time alone.
Shortlist versus browsing
Compare repeated views of one or two units with broad movement across many units.
Product action versus download
Compare filters, favourites, comparisons, and unit-specific enquiries with a generic brochure download.
Each test needs a written definition before anyone reads the result. Decide what counts as a return, how long a session gap creates a new visit, whether duplicate form submissions collapse into one lead, and which CRM stages count as a reservation. Freeze that version for the reporting period. If the definition changes, begin a new series or restate the old one.
Report absolute counts with rates. A 30% reservation rate based on ten leads is three reservations; one additional deal moves the percentage by ten points. A 12% rate based on 500 leads is a different kind of evidence. Show the count, the period, and an interval or at least the sample size. Precision in the chart should never exceed precision in the data.
A 30-day implementation that stops at the right place
The first week is an inventory, not a dashboard build. List the decisions a buyer can make on the current experience: choose a building, set a bedroom range, open a unit, compare it, save it, request its brochure, or enquire. Map each action to the unit ID and project ID already used by the inventory. If the public page calls a home B-207 while the CRM calls it Building B / 2.07, fix that seam before adding events.
In week two, implement the four minimum rows and test them with ordinary journeys. Use a new visitor, a returning browser, a consent refusal, a cross-device visit, an enquiry with a unit selected, and an enquiry with no unit selected. Sales should see the same unit and filters the tester chose. Analytics should keep the anonymous sessions separate until the permitted connection exists.
Week three is reconciliation. Compare form submissions in analytics with accepted leads in the CRM. Compare unit IDs in events with the current inventory. Find internal traffic, test records, duplicated submissions, and events that fire twice. Publish the mismatch rate. A benchmark with 92% of enquiries linked can be useful if the missing 8% is visible. A dashboard that silently drops the same 8% is not.
Week four is the first review with marketing and sales in the same room. Read five real journeys from first session to enquiry. Then look at the aggregate rows. Ask which event helped sales understand the buyer, which event was noise, and which missing value blocked the handoff. Do not add a predictive score in this meeting. The first month should end with trusted definitions, a known match rate, and one or two hypotheses for the next quarter. That is enough.
The smallest dashboard worth sharing
Return
Returning share of identified sessions, shown with the excluded unknown count and split by development.
Explore
Units viewed, repeated unit views, filter use, and the path from development to unit.
Enquire
Visitor-to-lead and unit-detail-to-lead rates, with the active unit and source kept on the lead.
Meet
Lead-to-booked-viewing rate, separated by project and campaign instead of blended into one portfolio number.
A development with a handful of bespoke units, one agent, and little campaign traffic may learn more from careful call notes than from a behavioral model. Keep basic source and enquiry tracking, then spend the analysis time where enough buyer paths exist to compare.
Who this benchmark is not for
Do not build this full benchmark for a five-home project with thirty site visits a month and one salesperson who speaks to every prospect. The sample will not support comparisons, and the implementation can cost more than the answer. Keep campaign source, unit context, consent, enquiry, and reservation records. Read the individual journeys instead.
It is also the wrong project for a team that cannot keep prices, availability, and unit IDs consistent across the website and CRM. Repair that shared record first. Behavioral detail attached to the wrong unit creates confidence in a false trail. The benchmark earns its place when inventory choice, traffic volume, and a multi-person sales process make individual memory unreliable.
Stop before the predictive score
The next tempting addition is a lead score: points for a return visit, a unit comparison, a brochure download, or time on page. Here the return can turn negative. A neat score built on inconsistent events hides bad data behind one number. Sales may also ignore leads that do not resemble the historical sample.
Test plain hypotheses first. Compare enquiry rates for new and returning visitors. Test whether distinct units viewed explains more than time on site. Compare repeated views of one unit with broad browsing. Report sample sizes and uncertainty. Segment by development when each group is large enough.
Hsiao, Wang, and Lin's peer-reviewed Decision Support Systems study found that low-immersion virtual reality related to property outcomes differently across price tiers. A separate NBER working paper studies why virtual-tour effects vary. Both use different markets and methods from this off-plan dataset. They support testing differences within the data at hand.
Most developers should stop at a clean event map, a development-level dashboard, and enquiry context inside the CRM. Add a predictive model after enough linked enquiries and reservations exist to test it on fresh data. A useful benchmark lets marketing and sales see the same buying sequence while preserving the limits of the evidence.
Map the path before you score it
See how Vinode connects development browsing, unit context, lead capture, and sales follow-up in one system.


AI Property Imagery in 2026: A Trust and Governance Playbook for Developers
A label tells buyers that AI touched an image. It cannot tell your team which design revision supports the image, who approved its claims, where it is live, or how to withdraw it.
The New-Build Sales Platform Checklist
Two agents reserve the same unit from two laptops, both reservations go through, and the listing stays available for eleven minutes. Test one live unit through inventory, availability, attribution and discount approval before you choose a platform.

AI Search Is Shrinking the Click: What Property Developers Should Measure Instead
AI answers can remove the visit before it happens. Keep tracking search traffic, but judge it by what follows: qualified arrivals, unit exploration, contextual enquiries and reservations.